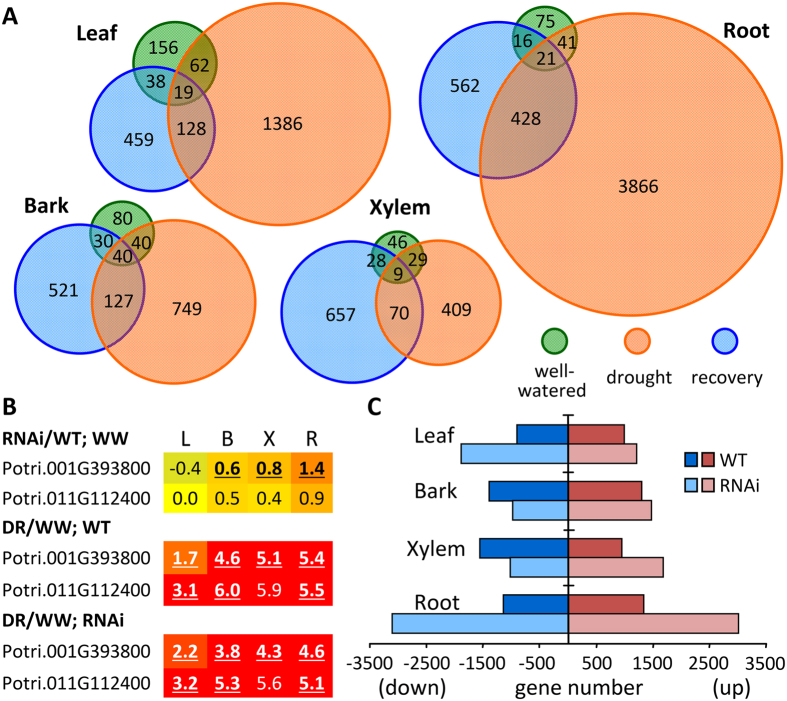
Figure 4. Overview of RNAi and drought treatment effects on gene expression.
(A) Venn diagram of DE genes in response to SUT4-RNAi in various organs and treatment regimes. (B) Heatmap depiction of SUT4-RNAi and DR effects on NCED (nine-cis-epoxycarotenoid dioxygenase) transcript abundance. Values are log2-transformed ratio responses. Significant effects are denoted by bold-underlines. (C) Histogram depiction of gene numbers significantly up or down-regulated by DR treatment. Significant changes in transcript abundance were based on Q ≤ 0.05 and fold-change ≥1.5 with n = 3 biological replicates.

