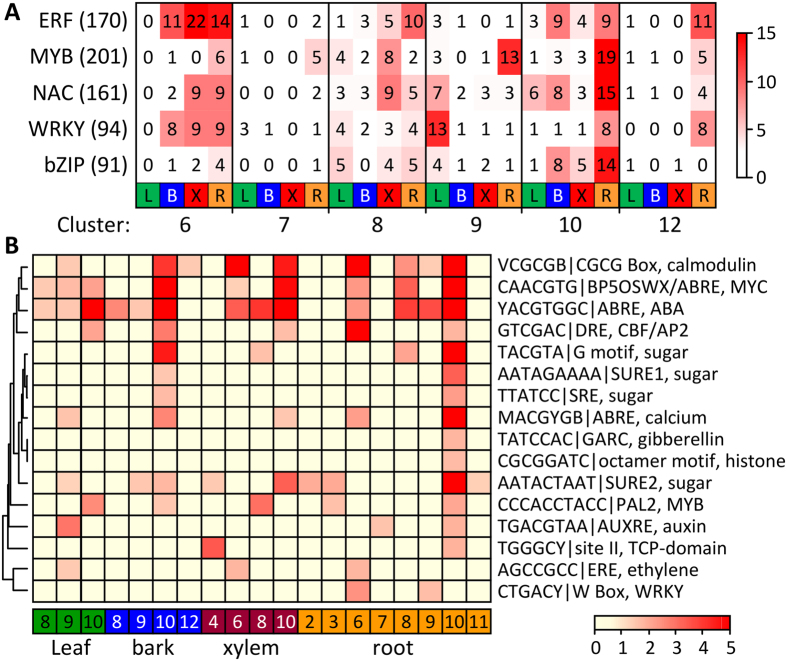
Figure 6. TF enrichment in SOM clusters.
(A) Heatmap distribution of TF families in the SOM clusters by organ. The number of TFs from each family is indicated for each SOM cluster-organ combination (only those with at least 10 members in any combination are shown). The number of TFs annotated for the Populus genome v3 is indicated in parentheses for each family. (B) Cis-element enrichment in SOM clusters by organ. Non-redundant cis elements were mapped onto promoter sequences and significant enrichment in the various SOM-organ gene clusters tested by chi-square statistics with false discovery correction (see Methods). The negative log10-transformed P values for cis-element enrichment were subjected to hierarchical clustering and visualized in heatmaps according to the color scale. Only SOM-organ clusters with significant cis-element enrichments were included in the heatmap.

