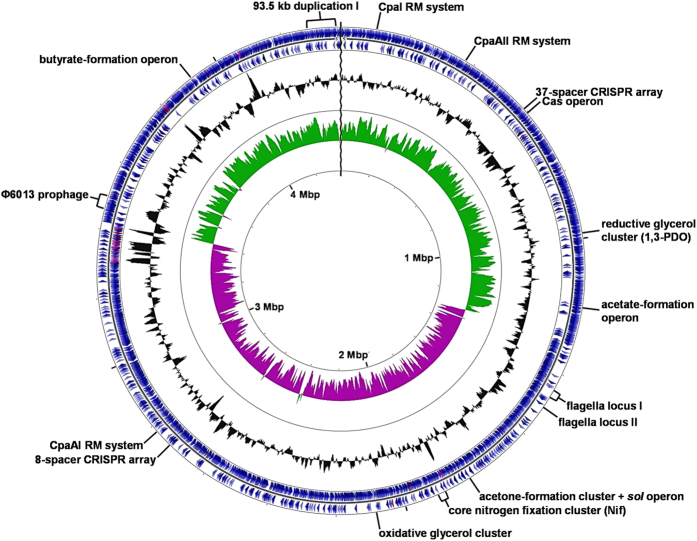
Figure 2. The chromosome of C. pasteurianum ATCC 6013.
Contig 1 (4,373,654 bp) is depicted as a circular chromosome and shows the approximate location of key genomic features discussed in this study. The two outermost circles indicate locations of gene coding regions (blue) in plus (circle one) and minus (circle two) strands. Genes encoding tRNAs and rRNAs are shown in fuchsia and lavender, respectively. Circle three shows G + C content (deviation from average) and circle four depicts G + C skew in plus (green) and minus (purple) strands. Genome scale is indicated in Mbp on the innermost circle. The CGView Server120 was used to construct the genome map.

