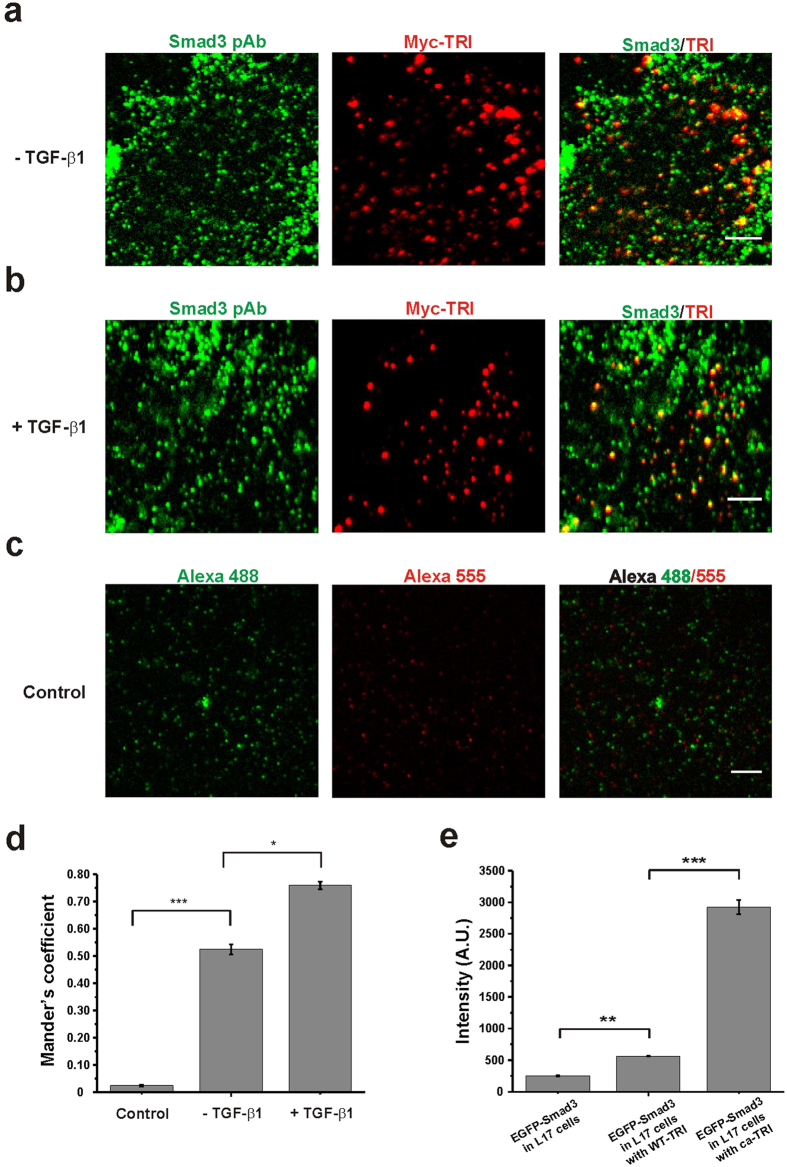
Figure 2. Binding of Smad3 with TRI on the cell membrane.
(a,b) Dual-view TIRFM imaging of Smad3 (pAb, Alexa-488) and Myc-TRI (Myc mAb, Alexa-555) in the Myc-TRI-expressing HeLa cells before (a) and after (b) TGF-β1 stimulation. The cells were immunostained with antibodies against Myc and Smad3. Scale bars: 5 μm. (c) Dual-view TIRFM imaging of Alexa-488 and Alexa-555 in the Myc-TRI-expressing HeLa cells. The cells were immunostained with the secondary antibodies but without using the primary antibody. They were used to exclude the non-specific binding of antibodies and the cross-talk of the imaging setups. Scale bar: 5 μm. (d) Quantification of colocalization of Myc-TRI with Smad3 using the Mander’s coefficient (Blobprob plugin, ImageJ). 52.4% ± 1.9% (n = 6 cells; mean ± SEM) and 75.9% ± 1.4% (n = 6 cells; mean ± SEM) of TRI colocalized with Smad3 in the absence and presence of TGF-β1, respectively. And the colocalization coefficient of the control experiment was 2.5% ± 0.3% (n = 6 cells; mean ± SEM) (*p < 0.05 and ***p < 0.001, t-test). (e) The averaged fluorescence intensity of the EGFP-Smad3 molecules at high expressing level on the plasma membrane of TRI-deficient L17 cells, L17 cells expressing WT-TRI-HA and ca-TRI-HA were quantified and compared. Data are mean intensity ± SEM from 6 cells (**p < 0.01 and ***p < 0.001, t-test).

