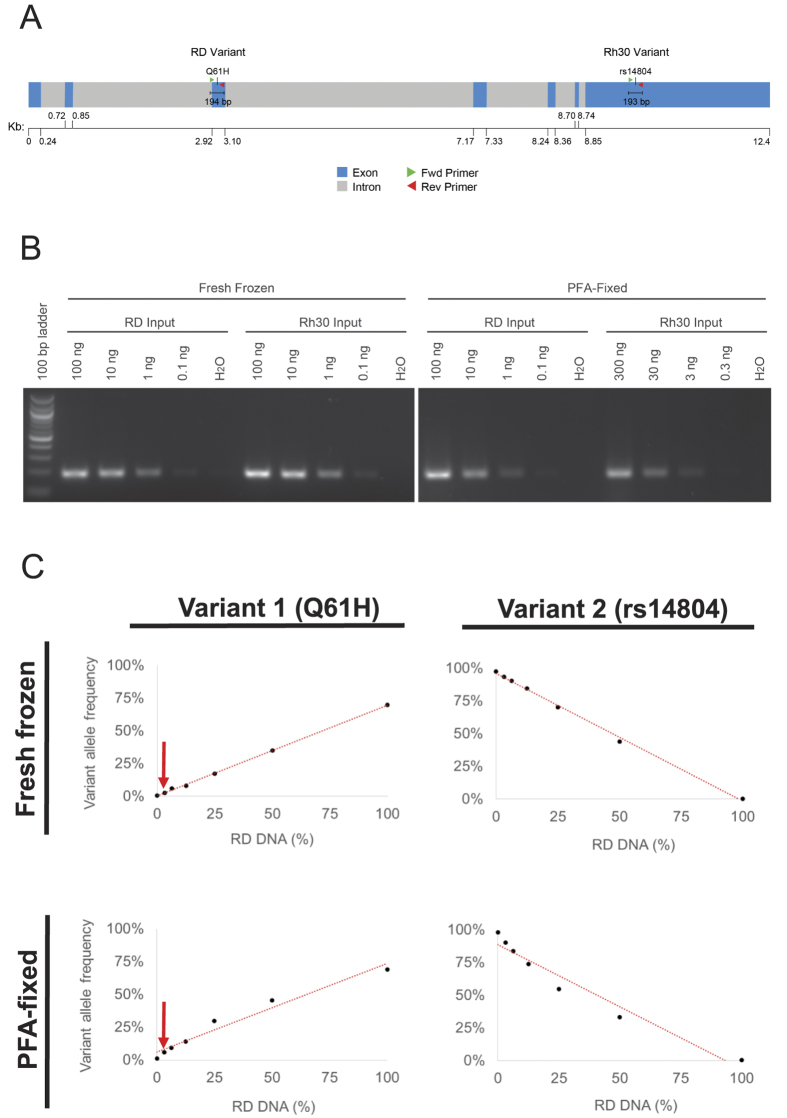
Figure 3.
(A) Schematic diagram shows DNA sequence variants in the human NRAS gene in either the RD or the Rh30 rhabdomyosarcoma cell lines. Forward and reverse primers used to amplify the genomic DNA for NGS are denoted by red and green arrows. (B) Photograph of ethidium bromide-stained 2% agarose gel shows semi-quantitative analysis of PCR amplification of one of the products noted in (A), confirming equal representation of each of the two sources of input DNA used for mixing experiment. (C) Graphs displaying the relative frequency of calls by NGS for each variant allele in DNA samples containing DNA from RD and Rh30 cells. The variant RD allele could be detected by NGS even when present 3.1% of the total DNA (arrow).

