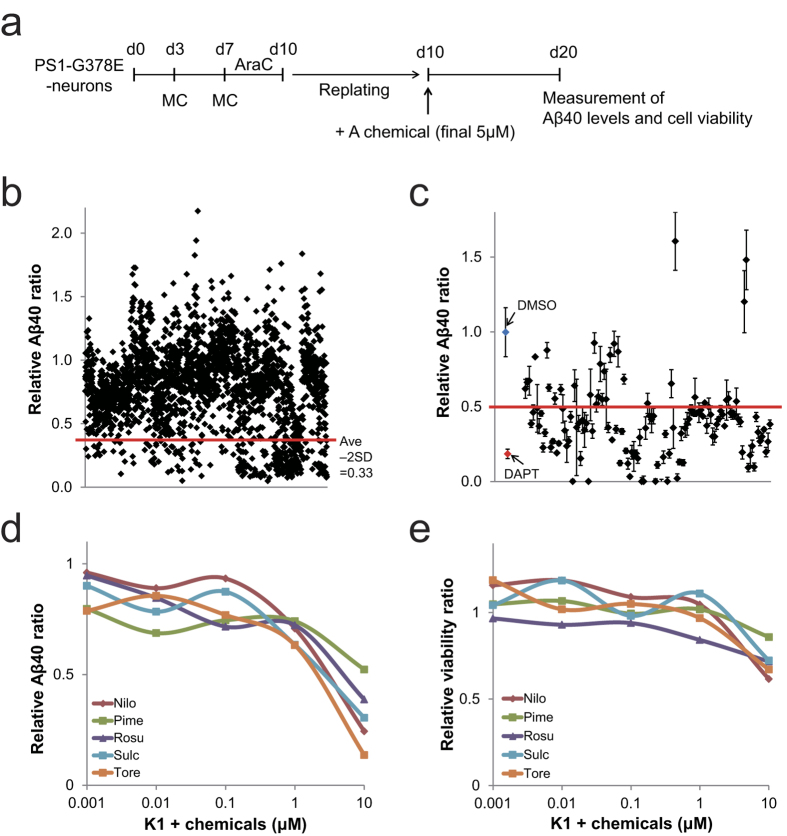
Figure 2. The screening of Aβ40 inhibitors using AD models.
(a) Scheme showing the cell culture procedure of chemical screening. (b) The result of first screening of Aβ40 inhibitors. The red line shows the value of the average ratio minus double the standard deviation (Ave - 2SD = 0.33). The compounds that reduced the Aβ40 ratio below Ave - 2SD value (0.33) passed the first screening. The Aβ40 level of DMSO treatment was considered to be 1.0. (c) The result of second screening in Aβ40 inhibitors. The red line indicates the criterion of hit compounds in the second screening (=0.5). (d,e) The effects of Aβ inhibition (d) and cell survival (e) in dose-response experiments using K1-derived neurons. These results show that PS1-overexpression did not influence the screening of Aβ inhibitors. The numerical data is shown in Supplementary Table S2. The amount of Aβ40 and cell viability in DMSO-treated PS1-G378E or K1 neurons was defined as 1.0. *P < 0.05, as determined by Steel’s test. Three independent experiments, each time in triplicates were performed (n = 3). Values are Mean ± SD. AraC, cytosine arabinoside; G378E, PS1-G378E neurons; K1, KhES-1-derived neurons; Nilo, Nilotinib; Pime, Pimecrolimus; Rosu, Rosuvastatin Calcium; Sulc, Sulconazole Nitrate salt; Tore, Toremifene Base.

