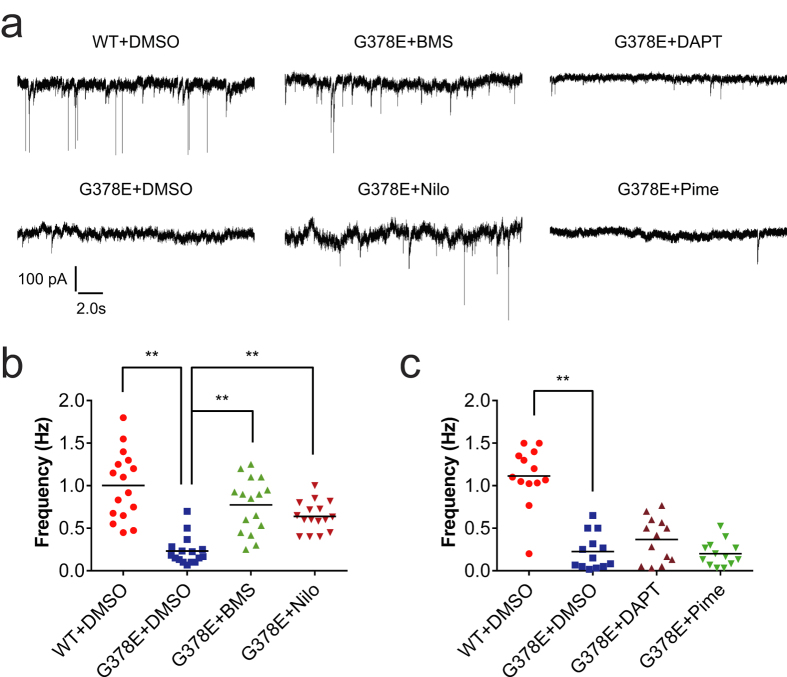
Figure 4. The recovery of synaptic dysfunctions in PS1-G378E neurons by BMS-708163 and Nilotinib.
(a) Representative sEPSC recordings from PS1-WT and PS1-G378E neurons cultured with DMSO and each of the chemicals, respectively. (b,c) The frequencies of sEPSCs after the chemical treatments that led to the recovery of the level of the RAB3A and SV2B proteins (b) and those that did not (c). **P < 0.01, as determined by Steel’s test in comparison to DMSO-treated PS1-G378E neurons. The black bars represent the median values. A dot indicates the sEPSC frequency of a single neuron. The sample sizes of (b) and (c) were n = 16 and 13 neurons, respectively. Four independent neural differentiation experiments were carried out, and sEPSC were measured using 3 or 4 neurons from each differentiation. See the legends of Figs 2 and 3 for abbreviations.

