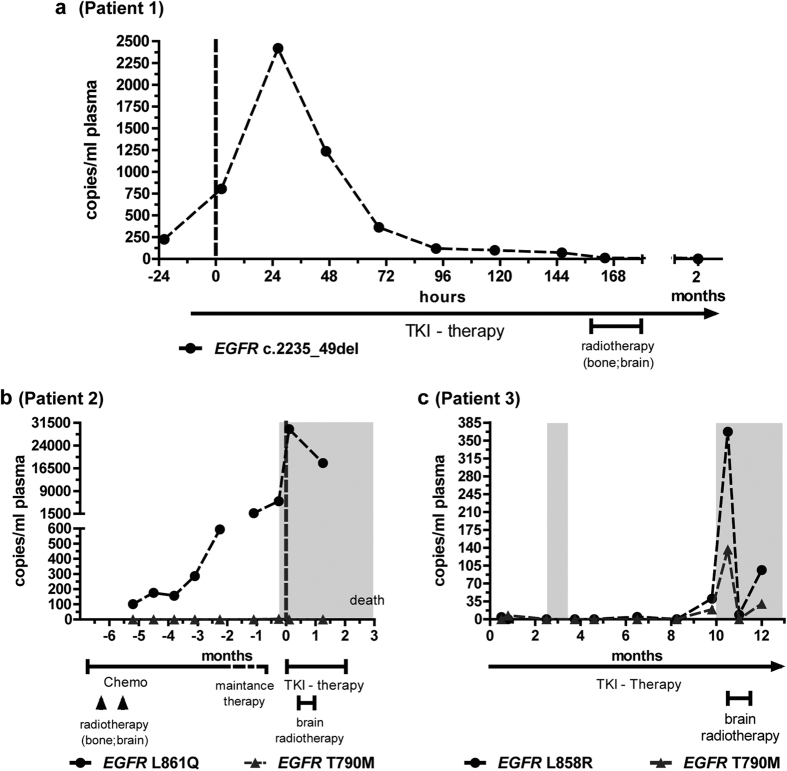
Figure 1. Occurrence of mutant EGFR cfDNA in response to therapy.
X-axis time frames, related to the start of TKI therapy (dashed vertical lines). Information about individual treatment schedules (chemo=chemotherapy; TKI-therapy; radiotherapy) are given below the x-axis. Y-axis: numbers of mutant alleles in plasma samples (copies/ml plasma), with sensitizing EGFR mutations labeled with black dots and T790M with grey triangles. White background: oncological stable state; grey background: disease progression.

