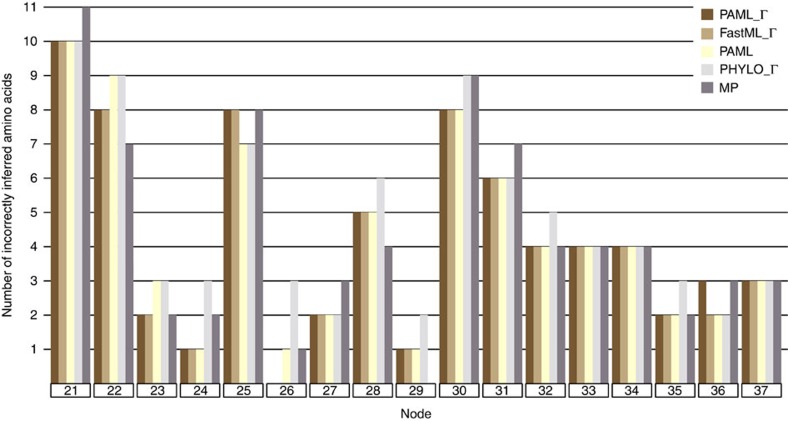
Figure 2. Number of incorrectly inferred amino acid sites for each node of the phylogeny.
The 19 leaf sequences from Fig. 1 were subjected to ASR analyses using Bayesian (PAML, FastML, PhyloBayes) with or without rate variation modelled as a gamma distribution (Г), as well as parsimony (MP). The inferred sequences were then compared to the true ancestral sequences from the 17 ancestral nodes in Fig. 1. Dark brown bars are PAML with a gamma distribution, light brown bars are FastML with a gamma distribution, yellow bars are PAML without gamma, light grey bars are PhyloBayes with a gamma distribution, and dark grey bars are maximum parsimony. Colour code is irrespective of FP colour emission phenotype.

