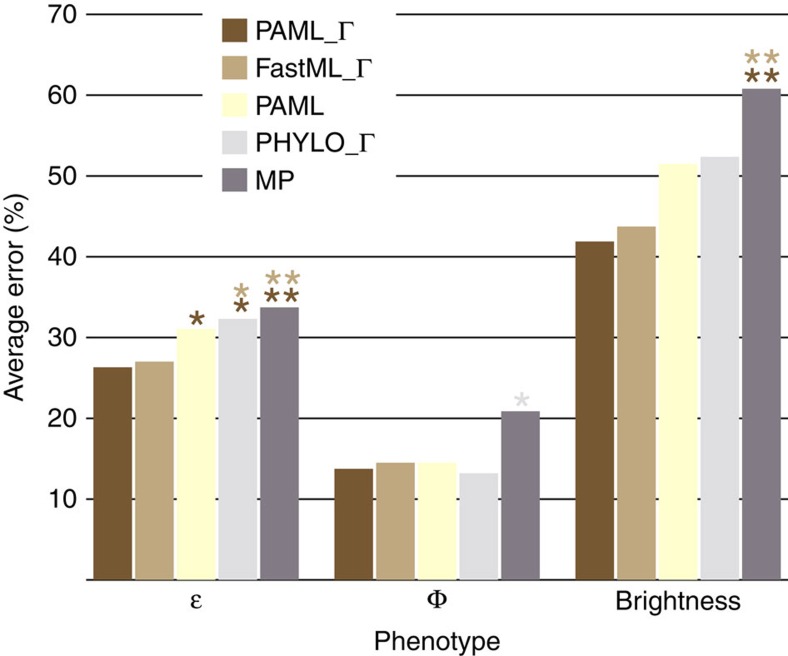
Figure 3. Average phenotypic error across all nodes for the five ASR procedures.
Extinction coefficient (ɛ), quantum yield (Φ), and brightness (product of ɛ and Φ) were determined for all incorrectly inferred ancestral FP proteins and compared to the properties of the true ancestral protein at each node and reported as a function of percent error. Dark brown bars are PAML with a gamma distribution, light brown bars are FastML with a gamma distribution, yellow bars are PAML, light grey bars are PhyloBayes with a gamma distribution, and dark grey bars are maximum parsimony. Single and double asterisks represent confidence at 95% and 99% levels, respectively, and are coloured according to the respective procedure that has significantly less error.

