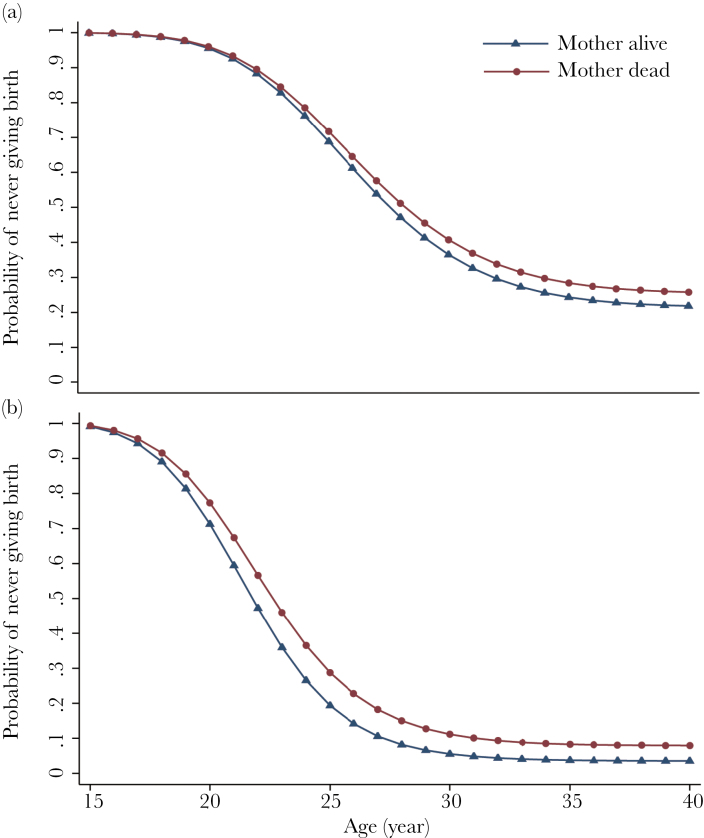
Figure 2.
Survival curves derived from a complementary log–log regression (see Table 3 for the full model) for fist birth of (a) male (n = 1665) and (b) female (n = 1537) offspring experiencing their mother’s death (line with circle)/not (line with triangle). Hazard ratio became 0 after age 40, thus we restrict the x axis to age 15–40.

