Fig. 6.

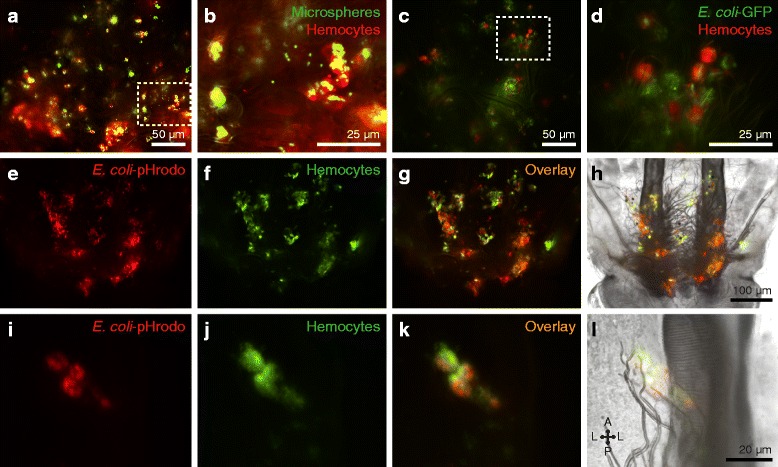
Tracheal tuft hemocytes show high phagocytic activity. a–d Fluorescence imaging of the phagocytic activity of tracheal tuft hemocytes (CM-DiI; red) at 4 h post-injection of 1 μm fluorescent microspheres (a, b) or GFP-E. coli (c d; green). Rectangles in a and c are magnified in b and d, respectively. e–h Series of fluorescence images (e–g) and bright-field overlay (h) of the tracheal tufts showing the significant overlap of pHrodo-E. coli fluorescence (red) and hemocyte fluorescence (DiO; green) at 4 h post-treatment. i–l Series of fluorescence images (i–k) and bright-field overlay (l) of a cluster of four tracheal tuft hemocytes (DiO; green) that have phagocytosed pHrodo-E. coli (red), showing a significant overlap in fluorescence signal. Directional arrows: A anterior, P posterior, L lateral
