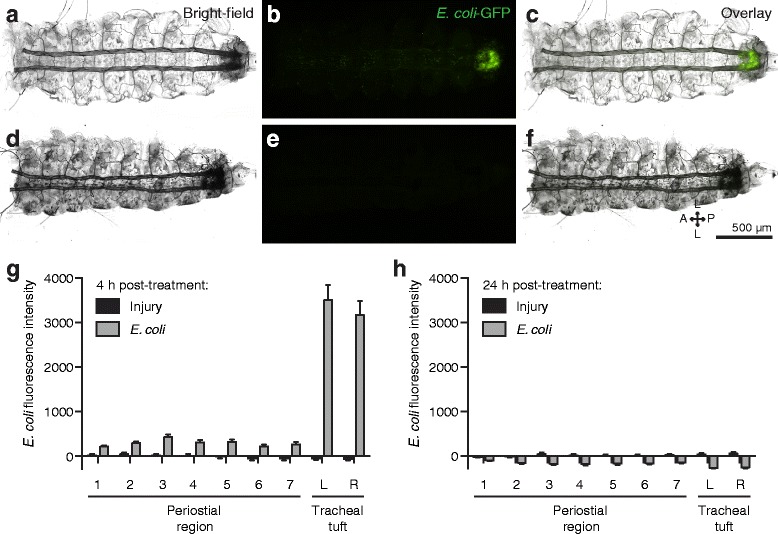
Fig. 7.

E. coli aggregate in the tracheal tufts, where they are rapidly destroyed. a–f Bright-field (a, d), fluorescence (b, e), and overlay (c, f) images of a dissected dorsal larval abdomen at 4 h (a–c) and 24 h (d–f) post-infection with GFP-E. coli (green). At 4 h, the bacteria have aggregated in the eighth abdominal segment, whereas at 24 h little or no fluorescence was observed. g, h Mean intensity of fluorescence signal in the periostial regions (1–7) and the left (L) and right (R) tracheal tufts of injured and GFP-E. coli-treated larvae at 4 h (g) and 24 h (h) post-treatment. At 4 h, mean intensities from both tracheal tufts of the E. coli-treated larvae were significantly higher than those from any region of interest (ROI) in injured larvae (P < 0.0001 for all comparisons). At 24 h, with the exception of periostial region 1 (P = 0.2990), mean intensities from each ROI were significantly lower in the E. coli-treated larvae compared to injured larvae (P ≤ 0.0005 for all other comparisons). In g and h, whiskers denote the standard error of the mean (SEM). For a graphical presentation of how the ROIs were constructed, see Additional file 7: Figure S5A. Directional arrows: A anterior, P posterior, L lateral
