
Figure 1.
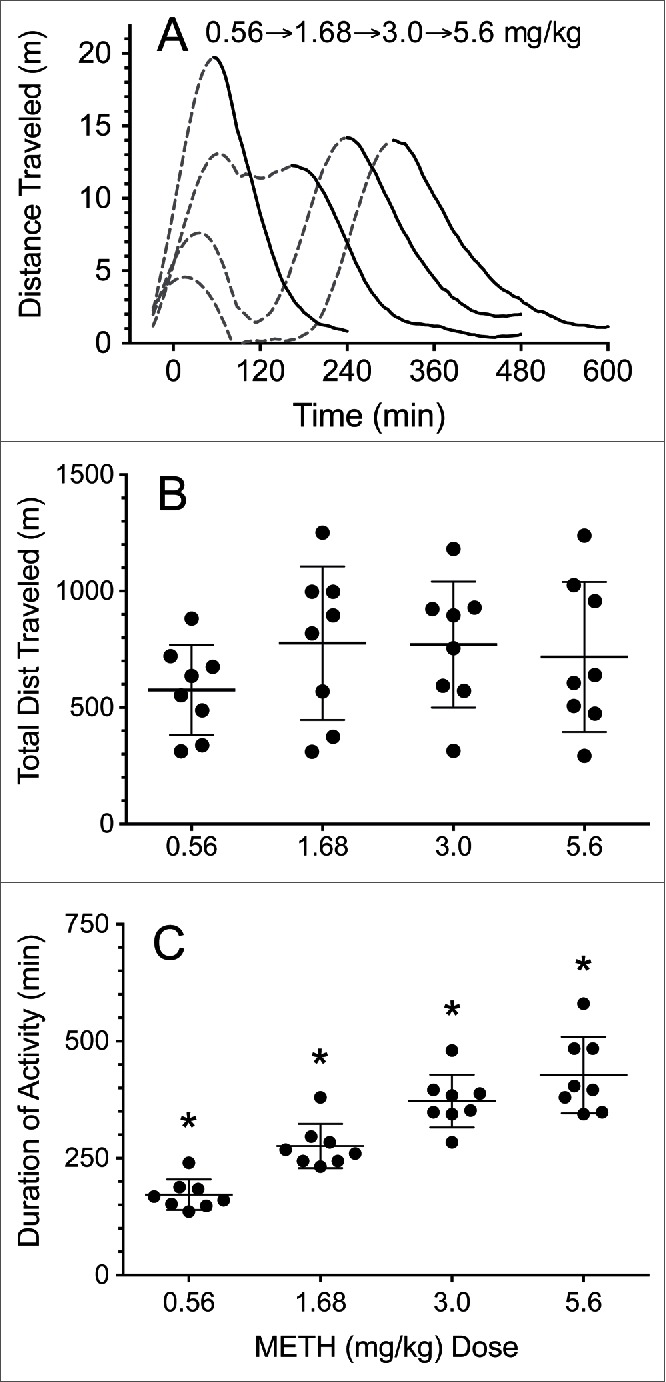
METH effects on distance traveled and duration of locomotor activity after 0.56–5.6 mg/kg increasing weekly METH doses in male rats (n = 8). (A) Distance traveled over time. Early data after METH dosing are depicted as a dashed line. The solid line denotes the terminal phase of the horizontal distance traveled data. These data were fit to a smoothing function for clarity. Curves for increasing doses are plotted from left to right. (B) Total average distance traveled in meters for each dose (±SD). (C) Average duration of action for each dose of METH induced locomotion (±SD). The * denotes a statistically significant difference (P < 0.05) from all other groups.