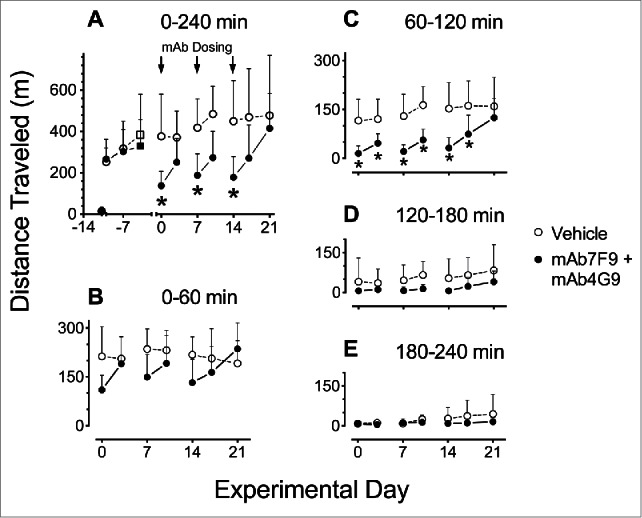
Figure 3.

Average distance traveled after 0.56 mg/kg METH challenge doses in vehicle- (open circles, n = 8) vs. mAb7F9-mAb4G9 treated rats (closed circles, n = 7) throughout the Phase 1 studies (days 0–21) (+SD). Panel A shows total measurements over 4 hrs on each experimental day including the vehicle and mAb with saline or METH administrations. Measurements are shown in progressive 1 hr intervals in Panels B-E. The * denotes statistical significance compared to time-matched vehicle controls (P < 0.05). The differences between vehicle and mAb treated rats on days 3 and 10 in panel A were not significantly different, but showed P values of 0.06 and 0.07, respectively.
