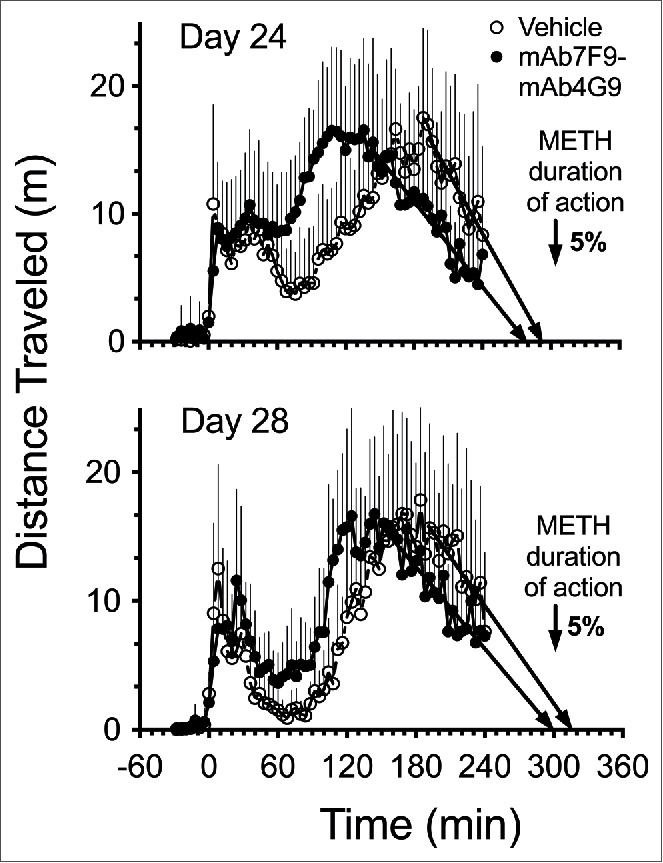
Figure 5.

Average distance traveled over time after a 1.68 mg/kg METH dose (3-fold greater than Phase 1) in vehicle- (open circle, n = 8) and mAb7F9-mAb4G9-treated (closed circle, n = 7) rats on day 24 and day 28 in Phase 2 studies (+SD). A best-fit linear regression line was fit to to the terminal phase distance traveled-time data points. This line was used to show the direction of the accumulating data and exactly where it intersected the time axis to estimate the time of the end of METH-induced horizontal distance traveled.
