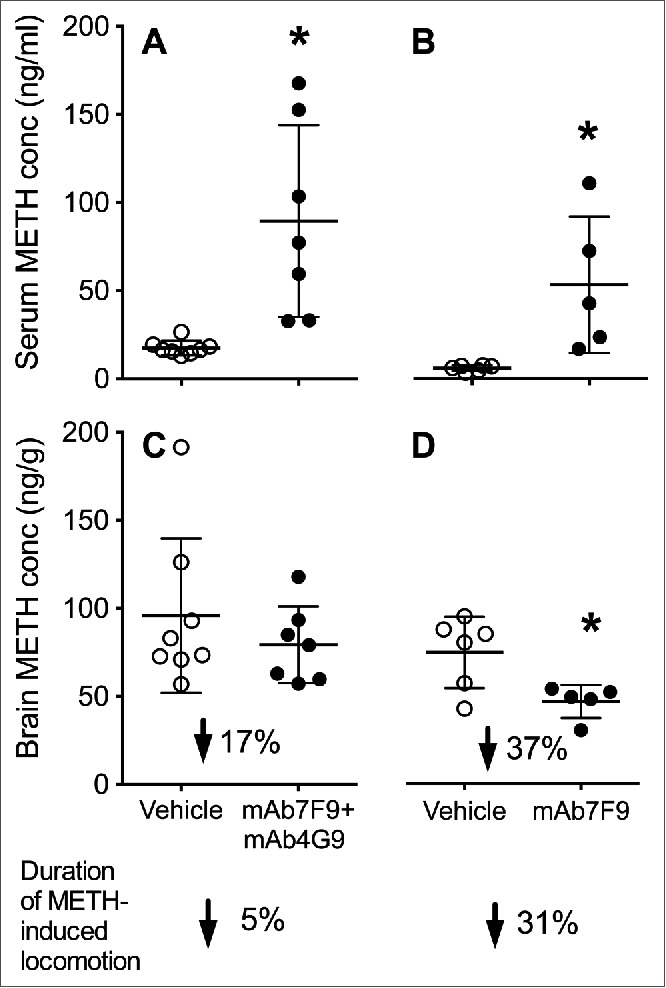
Figure 6.

Average day 28 METH serum (Panels A and B) and brain (Panels C and D) concentrations in mAb7F9-mAb4G9- (Panels A and C) and mAb7F9-treated rats (Panels B and D) (±SD). All data for mAb7F9 alone are from a previously reported study from our group.10 The * denotes statistical significance compared to time-matched vehicle-treated controls (P < 0.05). The percent reduction in the brain concentration values denotes the mAb-induced reduction in brain concentration compared to vehicle treated controls in each study. The lowest arrows and values denote the percentage reduction in the duration of METH-induced locomotion in the vehicle- and mAb-treated groups.
