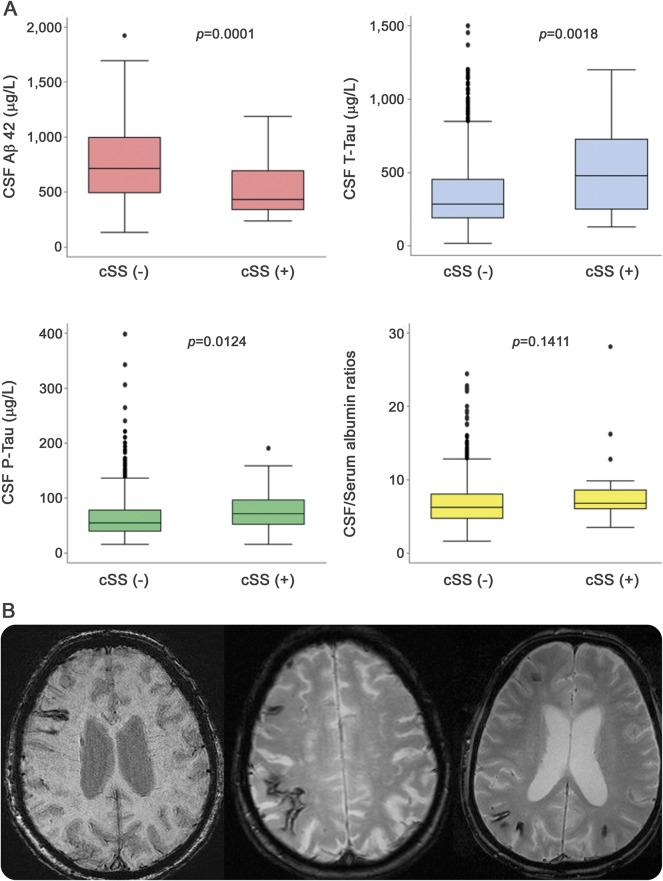
Figure. CSF biomarkers and cortical superficial siderosis (cSS); cSS on MRI.
(A) Boxplots show different CSF marker levels in patients with vs without cSS in the entire memory clinic series. Colors represent a way of referencing different panels. (B) Characteristic examples of cSS (arrows) seen as linear gyriform hypointensities on blood-sensitive MRI sequences (right, susceptibility-weighted images; middle and left, T2*–gradient recalled echo). Focal cSS is seen on the example in the left. The middle and right images are from 2 patients with Alzheimer disease and disseminated cSS, affecting multiple sulci. Aβ42 = β-amyloid 42; p-tau = phosphorylated tau; t-tau = total tau.

