. 2016 Sep 15;13:E128. doi: 10.5888/pcd13.160221

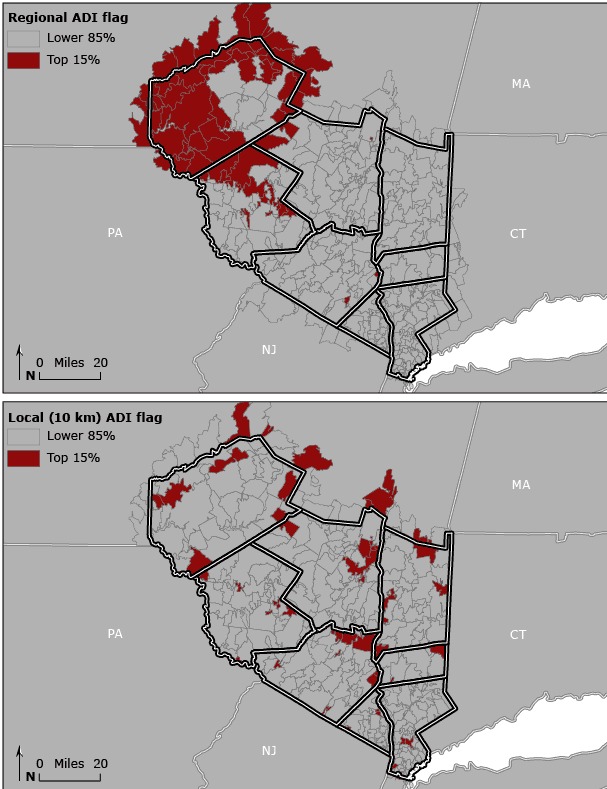
Figure 1.

This figure contains 2 maps, each depicting 8 counties in the Hudson Valley, New York. The first map shows the zip code tabulation area (ZCTA) area deprivation index (ADI) values dichotomized (top 15% and bottom 85%) based on regional values. The overall trend is that ZCTAs in the northwestern portion of the study area, mostly in Sullivan and Delaware counties, have a high level of deprivation. The second map shows the same study area, but uses the dichotomized ADI values based on local 10-km calibration. The results illustrate ZCTAs with high levels of deprivation are more evenly dispersed throughout the study area.

Regional versus local variation in the area deprivation index (ADI) in the Hudson Valley of New York. Dichotomized ADI values were calibrated on the basis of regional and local 10-km scales by zip code tabulation area.