. 2016 Sep 15;13:E128. doi: 10.5888/pcd13.160221

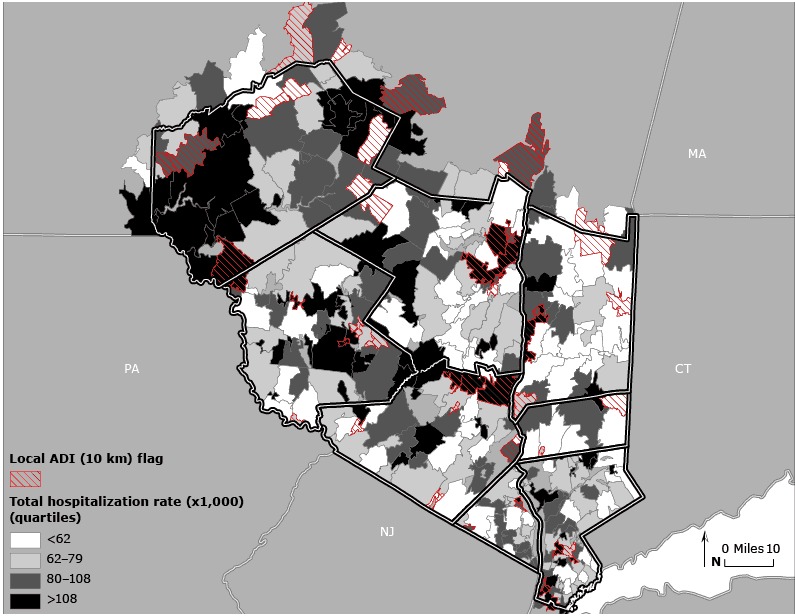
Figure 2.

This choropleth map shows 8 counties in the Hudson Valley, New York. The total hospitalization rate is shown by zip code tabulation area (ZCTA). There are 4 classes based on quartiles in the choropleth map. The lowest class represents fewer than 62 hospitalizations per 1,000 residents, the second, third, and fourth classes represent 62 to 79, 80 to 108, and 108 or more hospitalizations per 1,000 residents, respectively. ZCTAs that were flagged as having a high-level deprivation using the local 10-km calibration demonstrate the spatial coincidence of high local levels of deprivation and total hospitalization rates.

Local area deprivation index (ADI) values versus total hospitalization rate, Hudson Valley, New York. Zip code tabulation areas are indicated with cross hatching to depict local 10-km ADI values above the 15% threshold. Total hospitalization rates (1999–2000) are shown in quartiles. Maps of other health outcomes are available from the author upon request.