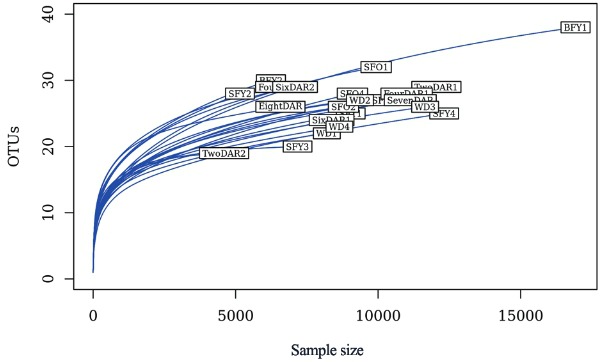
Fig. 1. : rarefaction curves for each sample. Operational taxonomic units (OTUs) at 3% distance were plotted for each sample against the number of sequences generated through 454 pyrosequencing (Sample size). SFY: sugar-fed young; BFY: blood-fed young; SFO: sugar-fed old; DAR: days after release in the mark-release-recapture experiment; WD: wild.