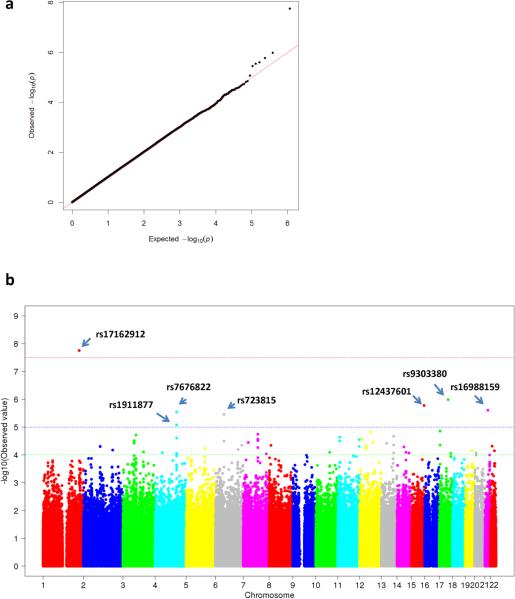
Figure 1.
Genome-wide association study of genetic variations and treatment response. (a) Q-Q plot for the association test of genetic variations. (b) Manhattan plot for the association test of genetic variations and SRI response. MQLS test was performed to test the association of variants associated with drug response. A red line indicates genome-wide significance (5×10⁻⁸); a blue line indicates the level of suggestive evidence for association (1×10⁻⁵).

