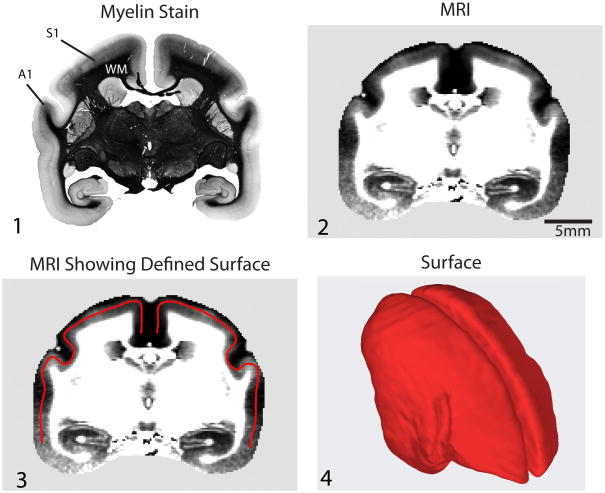
Figure 2.
Image Processing. A 40 μm-thick representative coronal histological section stained for myelin (Panel 1) and a matching 165 μm thick corresponding T1-weighted MRI section from a 3D image (Panel 2). The density of myelination is generally highest in a middle depth of the cortex (around Layer VI); thus, we define our surface at this depth (Panel 3). The 3D surface over the entire cortex at a middle depth is shown using surface rendering (Panel 4). The final step in our processing is to project the local MRI image intensity onto this surface to make a map.

