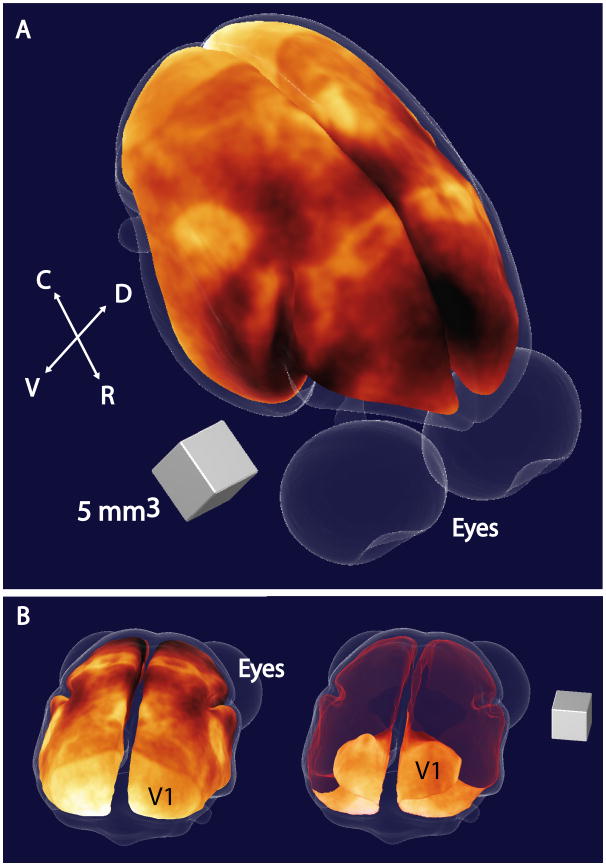
Figure 3.
3D map of myeloarchitecture in a representative 3-year old female common marmoset. The figure shows a view of a 3D map of the cortex in a marmoset centered on the dorsal parietal cortex (Panel 1). Here, the MRI intensity data is displayed using a hot colourmapto highlight contrast and areas of enhancement represent cortical areas with high myelin contents. The map is placed at a middle depth in the cortex, and the surface corresponding to the outside of the cortex is shown in light transparent blue. By rotating the map to a view centered on the occipital cortex (Panel 2), we can better see the primary visual cortex (V1) and by making the dorsal surface of our map transparent (shown in red), we can see the extension of V1 into the calcarine fissure. (C = caudal, R = rostral, V = ventral, D = dorsal)

