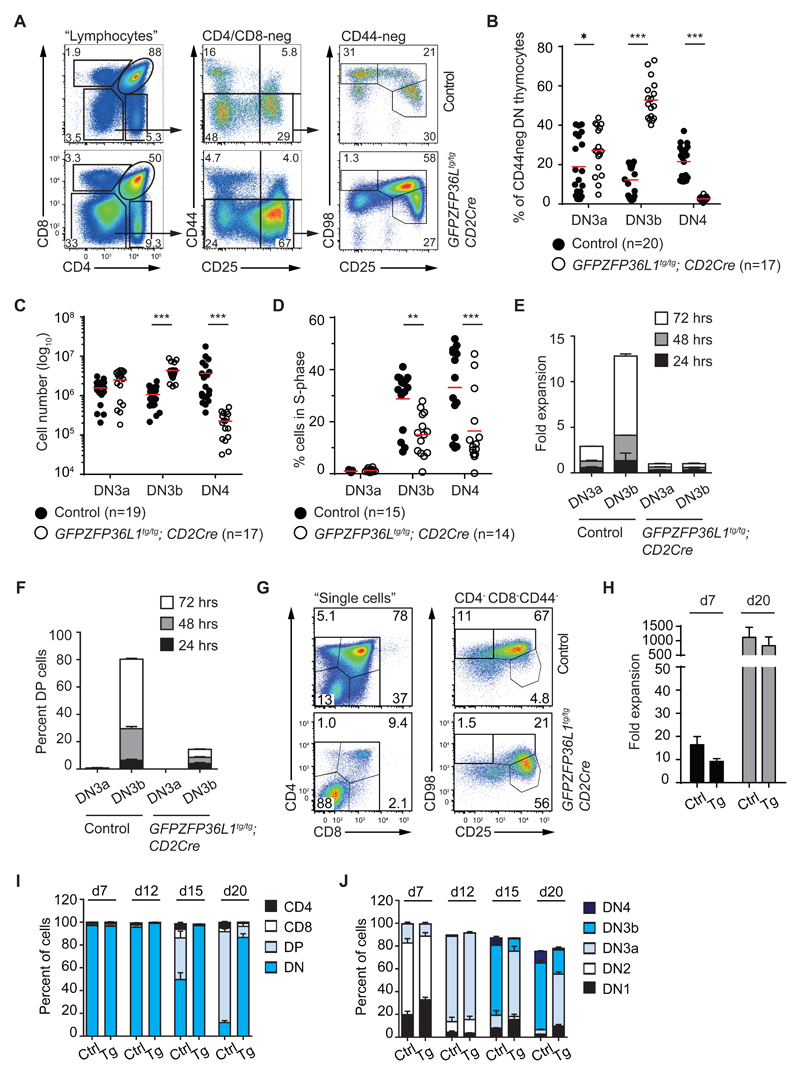
Figure 4. The cell cycle is inhibited in GFPZFP36L1 transgenic mice.
(A) Representative FACS plots showing lymphocyte subsets defined by CD4/CD8 (left panel), CD4/CD8-neg DN cells defined by CD44/CD25 (middle panel), and CD44-neg DN3a (CD25high, CD98low), DN3b (CD25int, CD98high) and DN4 (CD25-, CD98high) cells from Cre-negative control and GFPZFP36L1tg/tg; CD2Cre (Tg) mice.
(B) Proportions of DN3a, DN3b and DN4 cells (gated as in (A)) from control and GFPZFP36L1tg/tg; CD2Cre mice.
(C) Absolute cell numbers of DN3a, DN3b and DN4 cells as described in (B).
(D) Proportion of cells incorporating BrdU in S-phase within DN3a, DN3b and DN4 populations, defined as in (A).
(E) Fold expansion of sorted DN3a or DN3b cells from control and GFPZFP36L1tg/tg; CD2Cre mice after 24, 48 or 72 hrs of OP9-DL1 co-culture.
(F) Percentage of sorted DN3a or DN3b cells from control and GFPZFP36L1tg/tg; CD2Cre mice differentiating into CD4/CD8-pos DP cells after 24, 48 or 72 hrs of OP9-DL1 co-culture.
(G) Fold expansion of bone-marrow derived hematopoietic stem cells (BM-HSCs) from control and GFPZFP36L1tg/tg; CD2Cre (Tg) mice after 7 and 20 days of co-culture on OP9-DL4 cells in the presence of 1ng/ml IL-7.
(H) Representative FACS plots showing CD4/CD8 (left panel) and CD98/CD25 (right panel) expression of BM-HSCs from control and GFPZFP36L1tg/tg; CD2Cre mice after 20 days of co-culture on OP9-DL4 cells.
(I) Percentage of BM-HSCs from control (Ctrl) and GFPZFP36L1tg/tg; CD2Cre (Tg) mice expressing CD4, CD8, CD4/CD8 (DP) or no CD4/CD8 (DN) markers after 7, 12, 15 and 20 days of co-culture on OP9-DL4 cells.
(J) Percentage of BM-HSCs as in (H), in the developmental stages DN1, DN2, DN3a, DN3b or DN4.
Data are collated from 4 (B, C), and 3 (D) independent experiments. Horizontal lines indicate mean with statistical significances calculated by 2way ANOVA with Holm-Sidak's multiple comparisons test (*p < 0.05, **p < 0.01, ***p < 0.001) and number of mice indicated in the figure. (E-I) Data is representative for 2 independent experiments with 4 (E, F) and 6 (I, J) biological replicates per genotype. (E, F) 2-3 technical replicates are shown per genotype.

