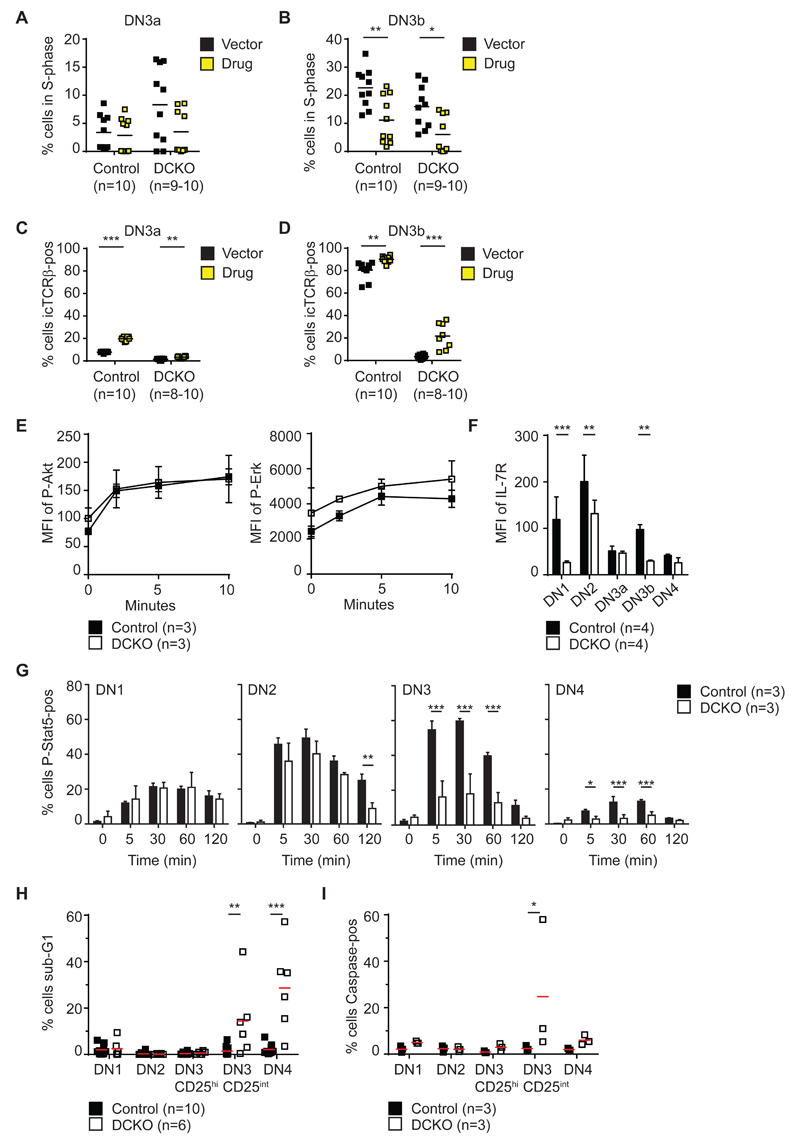
Figure 5. Lack of icTCRβ signaling correlates with increased apoptosis and is only partially rescued by pharmacological inhibition of cell cycle progression.
(A) Percentage of DN3a cells in S-phase (as gated on Dapi profile) from control (Zfp36l1/2fl/fl) and Zfp36l1/2fl/fl; CD2Cre (DCKO) mice, after 1-day of treatment with vector or palbociclib (drug).
(B) Percentage of DN3b cells in S-phase as described in (A).
(C) Percentage of DN3a cells positive for icTCRβ as described in (A).
(D) Percentage of DN3b cells positive for icTCRβ as described in (A).
(E) Median fluorescence intensity (MFI) of P-Akt and P-Erk in DN3 cells (CD44-, CD25+) from control (Zfp36l1/2fl/fl) and Zfp36l1/2fl/fl; CD2Cre (DCKO) mice after 0, 2, 5 and 10 min of PdBU stimulation. Depicted is the mean +/- SD.
(F) MFI of IL-7R on DN subsets from control and DCKO mice. Depicted is the mean + SD.
(G) Percentage P-Stat5-positive DN1-4 cells from control and DCKO mice after 0, 5, 30, 60 and 120 min of stimulation with IL-7. Depicted is the mean + SD.
(H) Percentage of cells in subG1 cell cycle phase of DN subsets from control and DCKO mice. Horizontal line represents the mean.
(I) Percentage of Caspase-pos cells in DN subsets as gated in (D) from control and DCKO mice. Horizontal line represents the mean.
Data are representative for 3 (E, P-Akt; G), 2 (E, P-Erk), 4 (F) and 1 (I) independent experiments with 6-9 (E), 12-14 (F), 9 (G) and 3 (I) biological replicates per genotype. (A-D, H) Data are collated from 2 independent experiments with 8-10 (A-D) and 6-10 (H) mice as indicated in the figure. The horizontal line represents the mean with statistical significances calculated by 2way ANOVA with Sidak's multiple comparisons test (A, B, C, D, F, G) or with Holm-Sidak’s multiple comparisons test (H, I) (*p < 0.05, **p < 0.01, ***p < 0.001).

