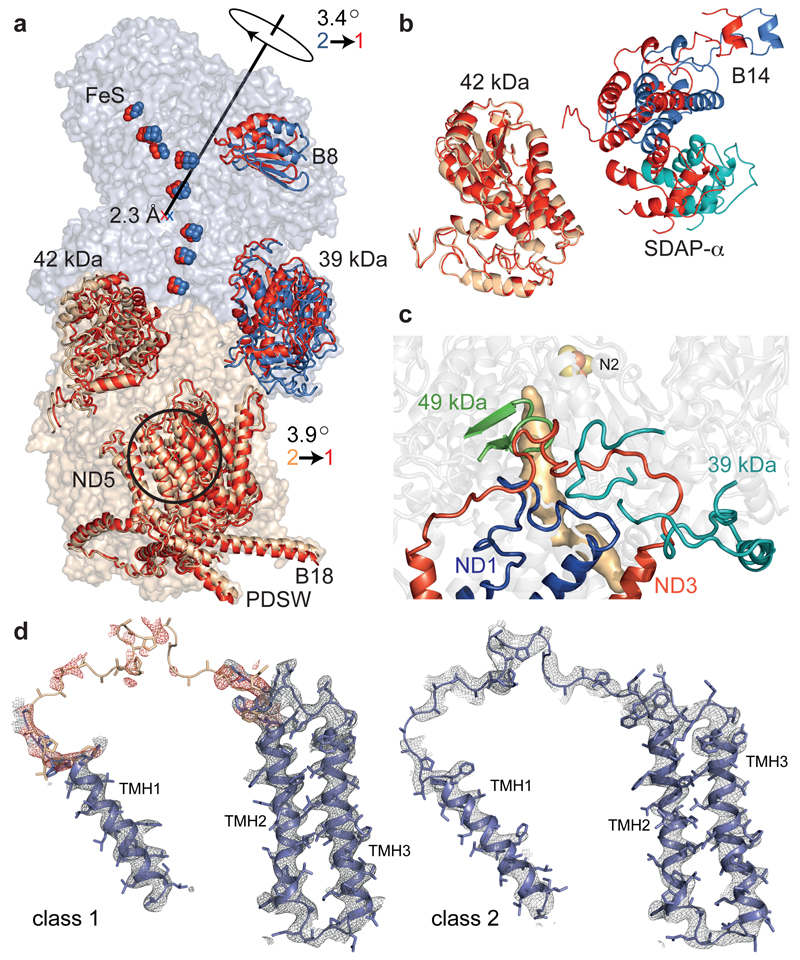
Figure 4. Relationships between classes 1 and 2.
a) Class 1 (red) and 2 (blue/wheat) were superimposed using ND1+ND3 and viewed along the axis of rotation for ND4+ND5. See ED Table 4 for details of the transformations. b) Change of ~10 Å in the relative positions of B14+SDAPα (hydrophilic domain) and 42 kDa (membrane domain); class 1 in red, viewed from the matrix. c) Loops (ND1 TMH5-6, ND3 TMH1-2, 49 kDa β1-β2 and in 39 kDa) in class 2 that are disordered in class 1, with the ubiquinone-binding site; adjacent TMHs/strands are shown for clarity. The site cannot be detected in class 1 as it appears open. d) Densities for the loop connecting ND3 TMH1-2. For class 1, the loop from the class 2 model (white) was used to identify the density in red.

