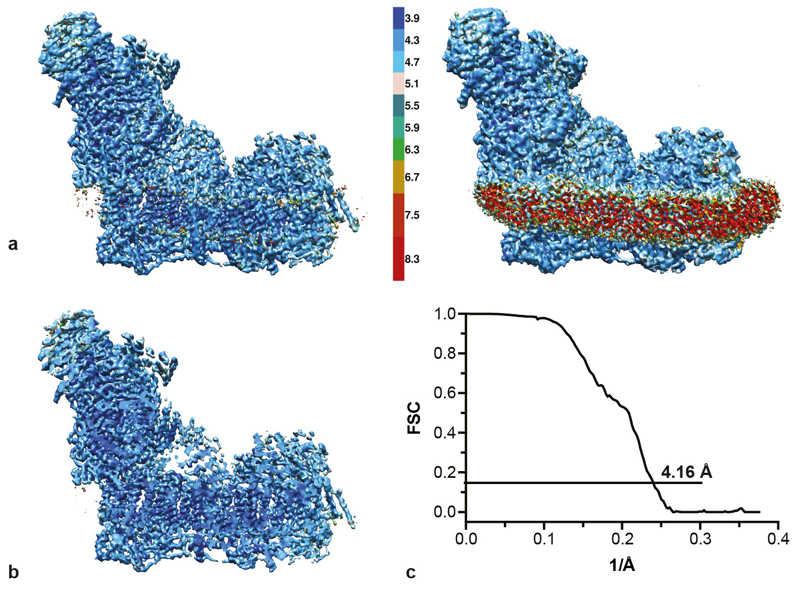
ED Figure 1. Resolution estimation and ResMap analysis of the density map for complex I before classification.
a) The map, shown at two different contour levels, is coloured according to the local resolution, as determined by ResMap35. At the higher contour level (left), the majority of the protein is resolved to 3.9–4.7 Å; only the very peripheral regions (parts of the 51 kDa, 24 kDa and 75 kDa subunits in the matrix arm, and the distal end of the membrane arm) are at lower resolutions of 5–6 Å. At the lower contour level (right), the detergent/lipid belt dominates the 7–9 Å resolution range. b) A slice through the map shows that large portions of the central, core regions are resolved to 4 Å or better. c) The FSC curve defines an estimated overall resolution of 4.16 Å at FSC = 0.143.

