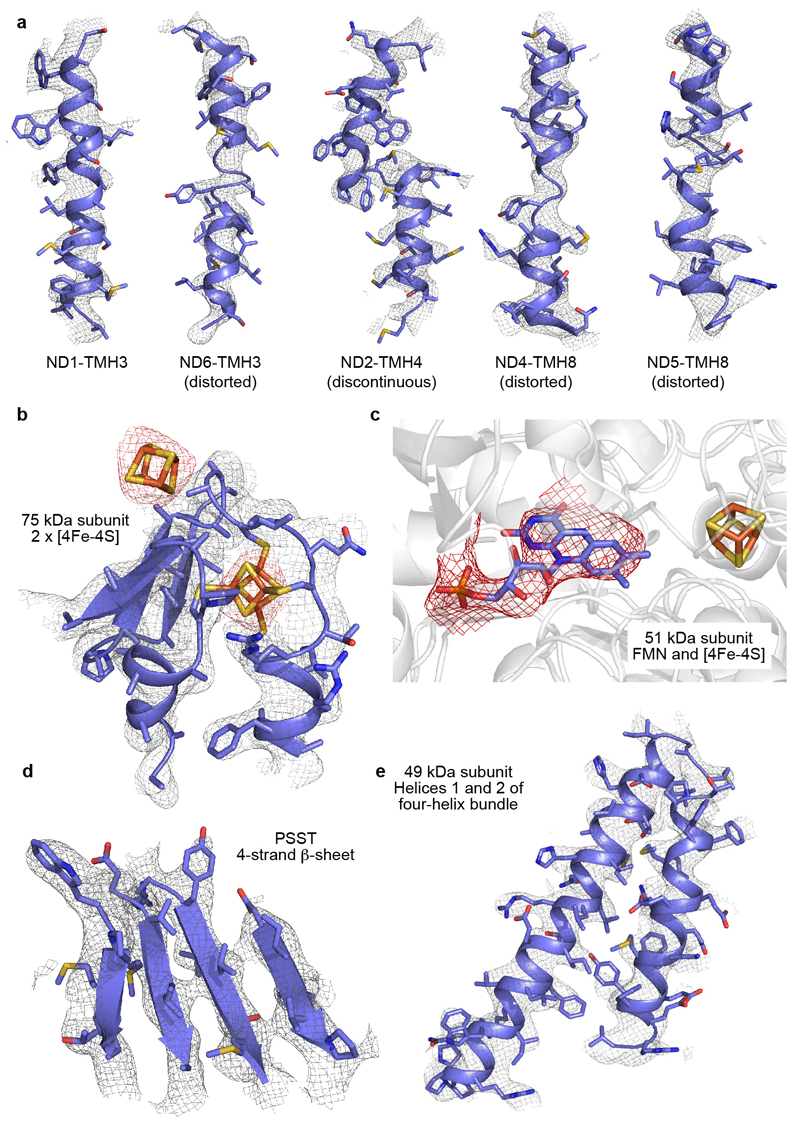
ED Figure 3. Example regions of the cryoEM density map for the core subunits, and the model fitted to the map.
a) A selection of TMHs from the membrane domain: TMH3 from ND1, the distorted TMHs in ND6, ND4 and ND5, and a discontinuous TMH from ND2. The series of TMHs from left to right illustrates the decrease in resolution along the domain. b) The two [4FeS4] clusters in the 75 kDa subunit (density in red, at higher contour level) with the protein ligating one of them. c) The FMN cofactor in the 51 kDa subunit. d) The β-sheet in subunit PSST, showing clear separation between the strands. e) Two helices from the 49 kDa subunit.

