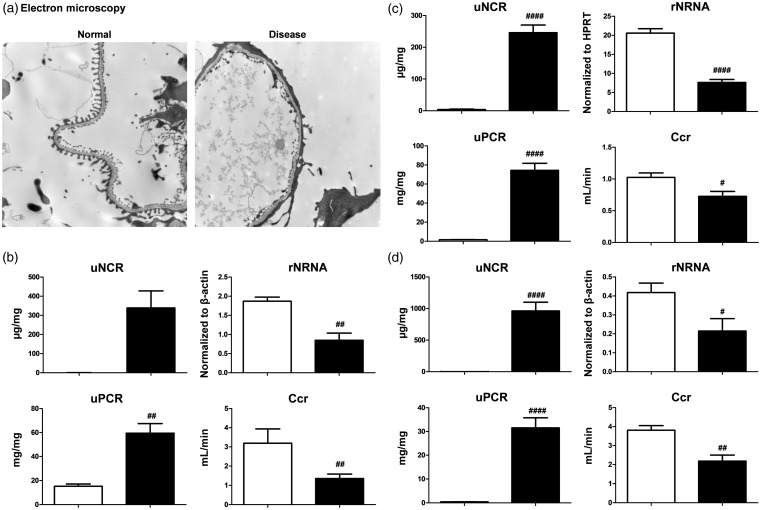
Figure 2.
ADR and PAN nephropathy models. (a) Foot process effacement, which causes podocyte injury, in ADR nephropathy mice was confirmed using electron microscopy. Magnification × 5000. (b–d) Urinary nephrin-to-creatinine ratio (uNCR), renal nephrin mRNA (rNRNA), urinary protein (uPCR), and creatinine clearance ratio (Ccr) were compared between normal (empty bar) and disease (black bar) groups of ADR nephropathy mice (b), ADR nephropathy rats (c), and PAN nephropathy rats (d). Values are mean ± S.E.M per group. #p < 0.05, ##p < 0.01, ####p < 0.0001 (unpaired t test)

