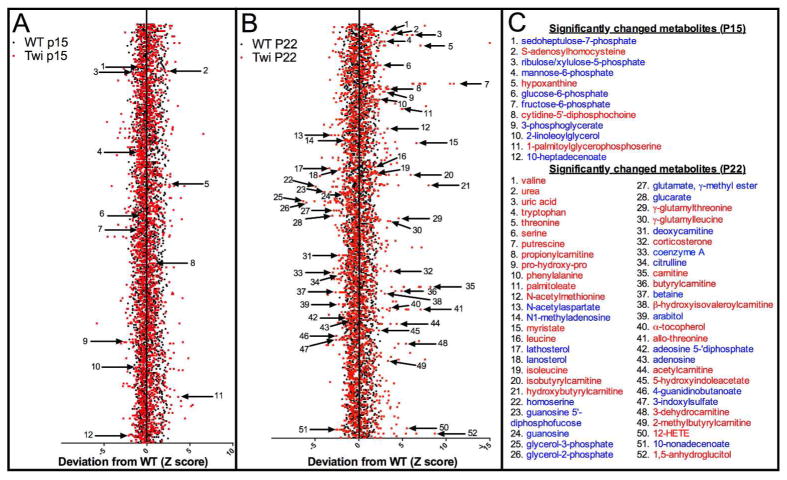
Figure 2.
Metabolomic profiling of hindbrains of twitcher and WT control mice. A) Non-supervised z-score plot of 314 compounds from P15 WT (n = 8) and P15 twitcher (n = 8) hindbrains, normalized to the mean of the WT samples. Each black or red point represents one metabolite in WT or twitcher sample, respectively. Arrows depict 12 metabolites that were found to be statistically significantly changed (p ≤ 0.05) by ANOVA comparisons. B) The same z-score plot of 314 compounds from P22 wildtype (n = 8) and P22 twitcher (n = 8). Arrows depict 52 metabolites that were found to be statistically significantly changed (p ≤ 0.05) by ANOVA comparisons. C) List of significantly changed metabolites from parts A (top) and B (bottom) listed in blue or red, representing a decrease or increase from WT respectively.

