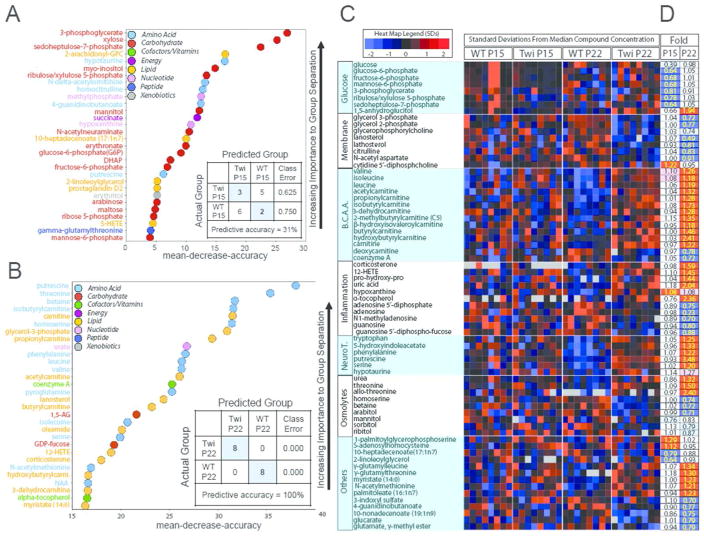
Figure 3.
Classification of metabolites by Random Forest statistical analysis. A) Random Forest classification in hindbrains of P15 twitcher compared to P15 WT gave a predictive accuracy of 31%, suggesting key differences in glycolysis and pentose phosphate pathway metabolism. B) Random Forest in P22 twitcher compared to P22 WT gave a predictive accuracy of 100%, with differences in fuel selection and energy metabolism, inflammation and oxidative stress markers. C–D) All 314 analyzed metabolites were subjected to supervised clustering via Random Forest classification to predict metabolic pathways that were globally changed in the twitcher hindbrain, yielding glucose metabolism, phospholipid turnover, branched chain amino acid metabolism, inflammation and oxidative stress and neurotransmitter and osmolyte metabolism. C) Heat map shows the relative concentration of 70 metabolites (rows), grouped by sample type (column). Sample types are grouped by genotype (WT and twitcher) and age (P15 and P22). Colored squares represent the relative concentration of a given metabolite, defined as the number of standard deviations above or below the median value. B.C.A.A. = Branched Chain Amino Acids, NeuroT= neurotransmitters. D) Heat map shows the fold change performed on the 70 metabolites from C. Red and blue shaded cells indicate p≤0.05 (red indicates that the mean values are significantly higher for that comparison; blue values significantly lower). Light red and light blue shaded cells indicate 0.05<p<0.10 (light red indicates that the mean values trend higher for that comparison; light blue values trend lower). Two single ANOVA comparisons (columns) analyzed the mean concentration of each metabolite as follows: (i) P15 twitcher to P15 WT mice and (ii) P22 twitcher to P22 WT mice.

