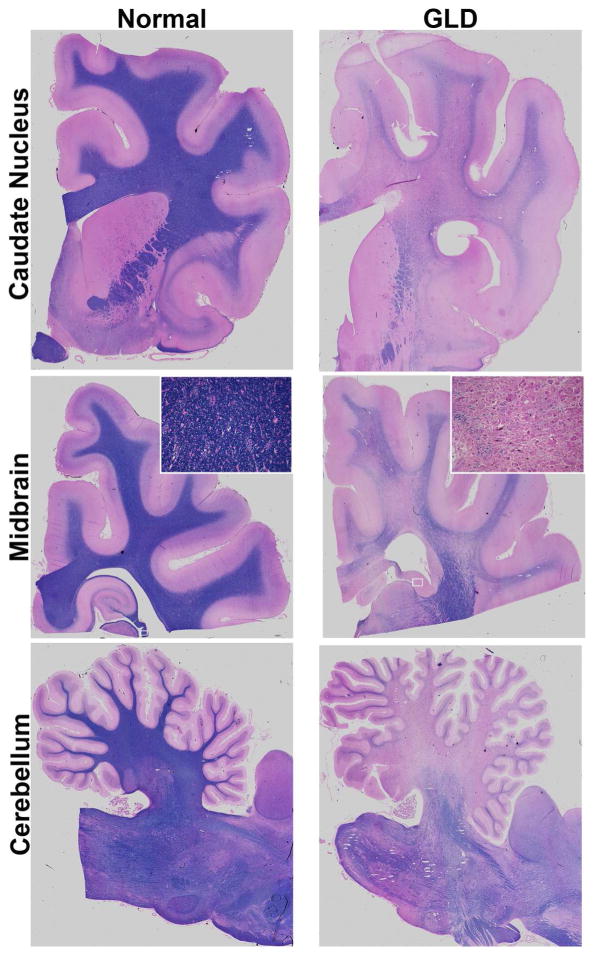
Figure 2.
Myelination in normal and GLD dog brain
Iron-eriochrome cyanine R histological stain shows loss of myelin (purple stain) in a GLD dog at end stage (right panel) compared to a normal age-matched control dog (left panel). Additionally, white mater regions are subjectively small in GLD dogs compared to normal control dogs. Cerebral hemisphere sections are shown at the level of the caudate nucleus (top panel), cerebrum at the level of the midbrain (middle panel), and cerebellum (bottom panel). Insets show 25x magnification.

