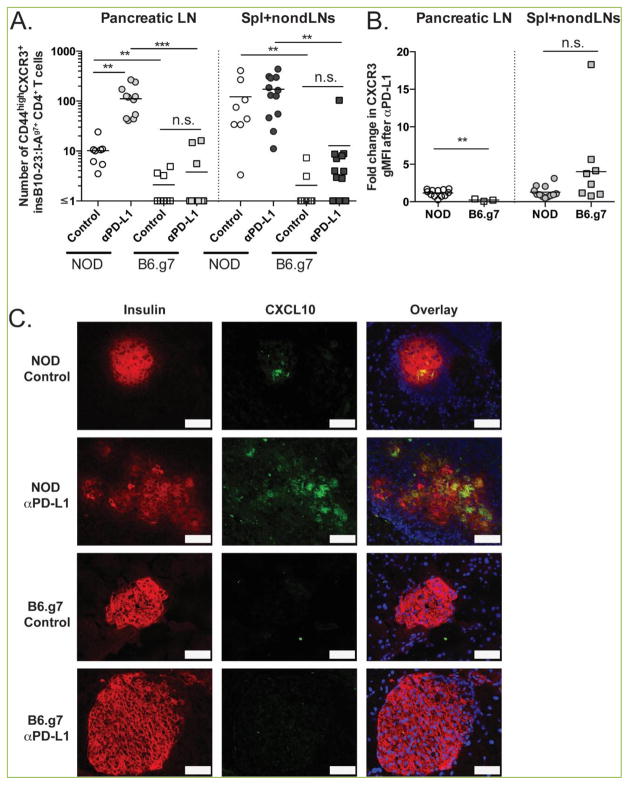
Figure 3. PD-1 pathway blockade increases the number of CD44high CXCR3+ insulin-specific CD4+ T cells in NOD but not B6.g7 mice.
NOD and B6.g7 mice were treated at day −3 and −1 with anti-PD-L1 (MIH6 clone; 250 μg/mouse) or isotype control (Rat IgG2a; 250 μg/mouse). (A) The number of CD44highCXCR3+ insulin-specific CD4+ T cells (identified by double-staining with insB10-23r3: I-Ag7-tetramers as described in Methods) in the secondary lymphoid organs of control and anti-PD-L1-treated NOD and B6.g7 mice. (B) Fold increase in geometric mean fluorescent intensity (gMFI) of CXCR3 after PD-L1 blockade from insulin-specific CD4+ T cells. Shown are compiled data from four independent experiments with n=2–3 per treatment group. (C) Immunofluorescent staining of CXCL10 expression in pancreas tissue from NOD and B6.g7 mice from anti-PD-L1 or isotype treated animals. Scale bar (white) corresponds to 50 μm. Images are representative of three independent experiments with >100 islets/treatment group.

