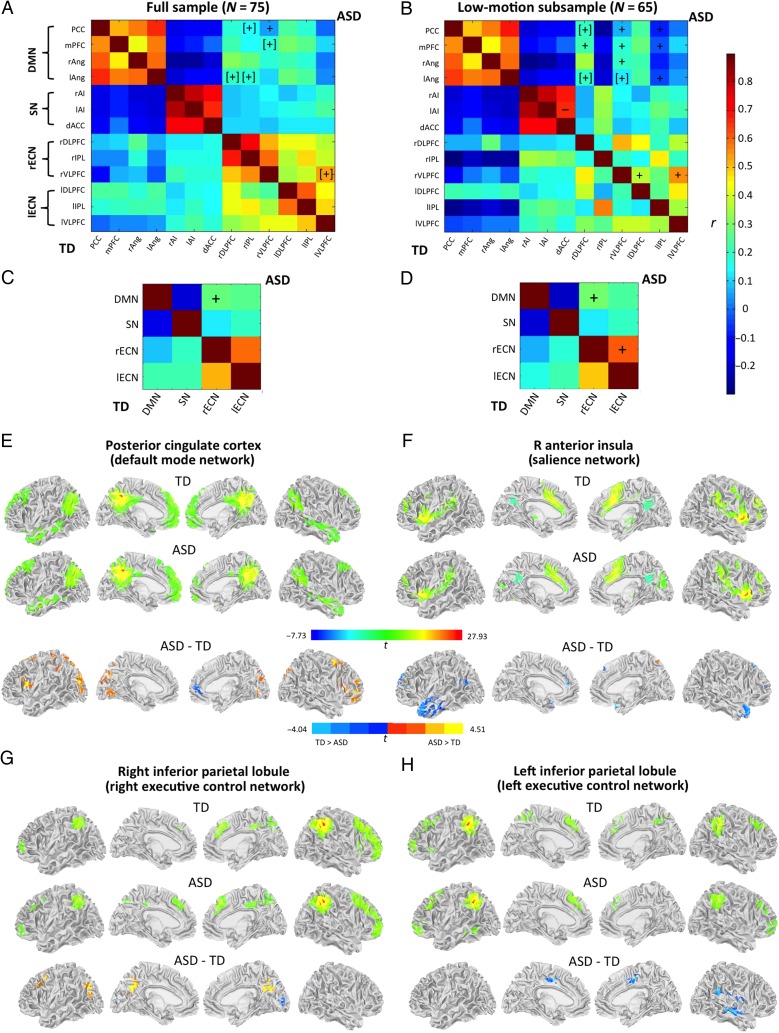
Figure 1.
Correlation matrices for all ROIs in ASD (upper right triangles) and TD groups (lower left) using (A) full sample and (B) low-motion subsample. Correlation matrices for networks (averaged across ROIs) using (C) full sample and (D) low-motion subsample. DMN, default-mode network; SN, salience network; rECN, right executive control network; lECN, left executive control network. +/−, significantly greater/weaker FC in ASD compared with TD group (P < 0.05, FDR-corrected); [+]/[−], analogous group differences at P < 0.05, uncorrected. For detailed statistical listing, see Supplementary Table 2. (E–H) Surface renderings of within-group functional connectivity (top) and between-group difference (bottom) for primary seeds of (E) default mode network, (F) salience network, as well as (G) right and (H) left executive control networks (all clusters P < 0.05, cluster-corrected).

