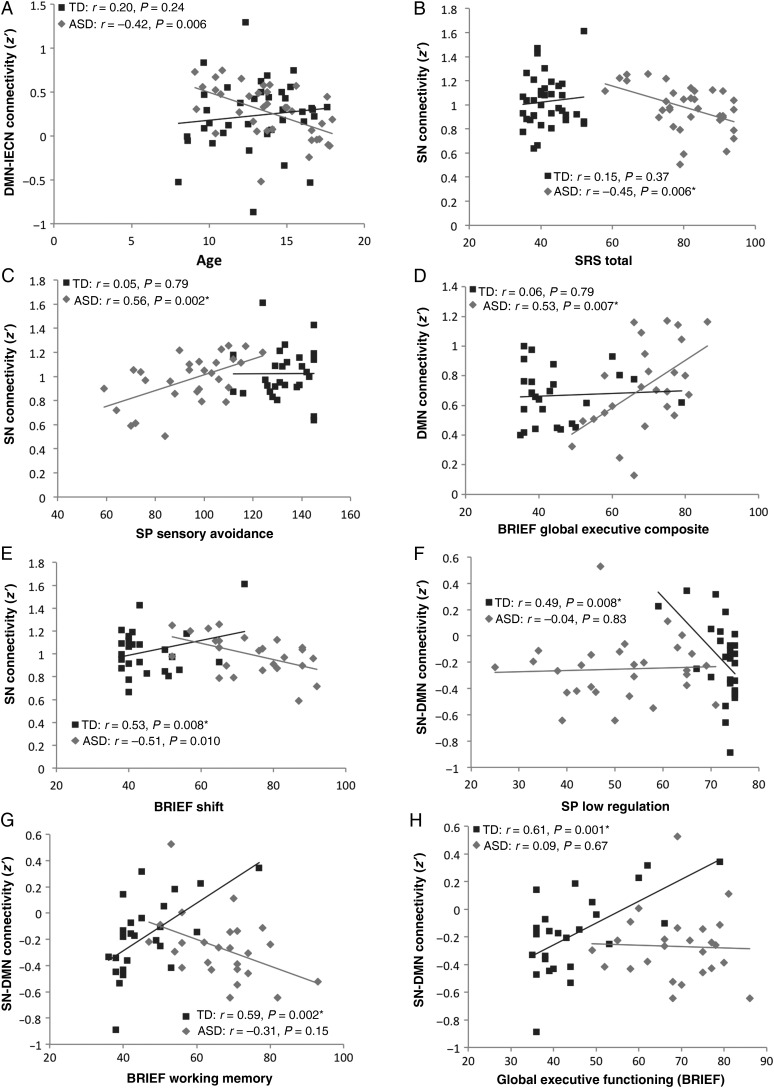
Figure 2.
Correlations of demographic and behavioral measures with connectivity for TD (blue) and ASD groups (red): (A) DMN–lECN within-network connectivity by age, (B) SN within-network connectivity index by SRS Total, (C) SN within-network connectivity index by SP Sensory Avoidance, (D) DMN within-network connectivity index by BRIEF Global Executive Composite, (E) SN within-network connectivity index by BRIEF Shift, (F) SN–DMN connectivity index by SP Low Regulation, (G) SN-DMN connectivity index by BRIEF Working Memory, and (H) SN–DMN connectivity by BRIEF Global Executive Functioning. *P < 0.05, FDR-corrected.

