Abstract
Brain structural development continues throughout adolescence, when experimentation with alcohol is often initiated. To parse contributions from biological and environmental factors on neurodevelopment, this study used baseline National Consortium on Alcohol and NeuroDevelopment in Adolescence (NCANDA) magnetic resonance imaging (MRI) data, acquired in 674 adolescents meeting no/low alcohol or drug use criteria and 134 adolescents exceeding criteria. Spatial integrity of images across the 5 recruitment sites was assured by morphological scaling using Alzheimer's disease neuroimaging initiative phantom-derived volume scalar metrics. Clinical MRI readings identified structural anomalies in 11.4%. Cortical volume and thickness were smaller and white matter volumes were larger in older than in younger adolescents. Effects of sex (male > female) and ethnicity (majority > minority) were significant for volume and surface but minimal for cortical thickness. Adjusting volume and area for supratentorial volume attenuated or removed sex and ethnicity effects. That cortical thickness showed age-related decline and was unrelated to supratentorial volume is consistent with the radial unit hypothesis, suggesting a universal neural development characteristic robust to sex and ethnicity. Comparison of NCANDA with PING data revealed similar but flatter, age-related declines in cortical volumes and thickness. Smaller, thinner frontal, and temporal cortices in the exceeds-criteria than no/low-drinking group suggested untoward effects of excessive alcohol consumption on brain structural development.
Keywords: adolescence, cortex, development, ethnicity, sex
Introduction
It is well established through in vivo neuroimaging that the human brain continues to change in regional tissue morphology throughout adolescence. Longitudinal investigations (Sowell, Thompson, Leonard, et al. 2004; Shaw et al. 2008; Raznahan et al. 2011; Sullivan et al. 2011; Storsve et al. 2014; Wierenga et al. 2014) of change with aging have largely confirmed initial cross-sectional reports of age-related differences (Jernigan et al. 1991; Pfefferbaum et al. 1994; Sowell, Thompson, and Toga 2004; Im et al. 2008). Typically, cortical gray matter volume (Raz et al. 2010; Pfefferbaum et al. 2013) and thickness (Sowell et al. 2007; Im et al. 2008; Chen et al. 2013; Hogstrom et al. 2013; McKay et al. 2014; Schmitt et al. 2014; Storsve et al. 2014) of the cortical mantle exhibit an inexorable decline from about age 10 years to senescence, although some cortical regions exhibit growth in surface area and volume until early adolescence, while cortical thickness declines from age 3 onward (Brown et al. 2012). One speculation is that cortical shrinkage in adolescence marks normal pruning, possibly in response to environmental demands to hone brain functions (Fields 2008), whereas later decline marks normal aging and associated declining function. During the “pruning” years (Feinberg 1974; Huttenlocher 1979; Chugani et al. 1987; Feinberg et al. 1990; Chugani 1998), white matter volume expands and does so into early adulthood (in vivo: Giedd et al. 1999; Colby et al. 2011; Pfefferbaum et al. 2013) (postmortem: Yakovlev and Lecours 1967). Underlying this complementary pattern of gray matter and white matter volume dynamics are regional differences in the timing of these changes (Bava et al. 2010; Raznahan et al. 2010) (for review, Toga et al. 2006; Stiles and Jernigan 2010; Giedd et al. 2014).
Heterochronicity in neurodevelopmental trajectories (Sowell, Thompson, Leonard, et al. 2004; Shaw et al. 2008; Giedd et al. 2014) is a likely contributor to change in cognitive strategy when confronted with a task or decision, proceeding from a bottom-up approach (Posner and Petersen 1990; Fjell et al. 2012), founded on stimulus-bound, concrete features perceptible with early maturing sensorimotor systems, to a top-down approach requiring abstraction and input from later-developing prefrontal, higher order systems (Luna et al. 2001; Corbetta and Shulman 2002; Lerch et al. 2006; Giedd et al. 2010; Spronk et al. 2012; Padilla et al. 2014) (cf., Casey and Jones 2010). Asynchronous development involves cortical location and analysis metric, where cortical volume decline and thinning do not occur in lockstep, nor does development of the underlying and connecting white matter fiber systems (cf., Gogtay et al. 2004). Each of these components may be further influenced by hormonal development, typically expressed as pubertal stage (Giedd et al. 1999, 2006; Sullivan et al. 2011). It remains unknown, however, whether focal regions of the developing brain are more or less vulnerable to environmental insult, such as trauma or toxins, and whether developmental processes are disrupted or can withstand such insult (cf., Anderson et al. 2011).
Hazardous drinking and illicit and licit drug use are common risky behaviors initiated in adolescence (Swendsen et al. 2012). The heightened risk taking may be at least partly attributable to asynchronous neurodevelopment and immature cognitive control processes. That excessive alcohol consumption, especially “binge drinking,” has the potential of disrupting brain structural and functional development forms the basis for a critical public health quest to identify the extent to which heavy drinking changes the course of the normal developmental trajectories of regional brain tissue, whether the normal course can be regained with sustained sobriety, and what factors contribute to damage or protection from damage (for review, Squeglia et al. 2014; Vetreno and Crews 2014). Cross-sectional study has identified prefrontal regions as especially vulnerable to drinking episodes in male and female adolescents who met criteria for alcohol use disorder (De Bellis and Narasimhan 2005). A recent study using a longitudinal design provided initial evidence for local trajectory deviation and direction in youth who engaged in heavy drinking relative to those who drank little to none during the course of the study (Squeglia et al. 2015). Specifically, heavy-drinking adolescents exhibited accelerated decline in frontal and temporal gray matter volumes and attenuated white matter growth (e.g., the corpus callosum) that was similar in both sexes. Remaining to be determined is whether consumed agents, notably alcohol and marijuana, are harmful to brain structures that are actively maturing, or alternatively, whether such structures are resilient to exogenous harm because of their extended structural plasticity.
To begin to address aspects of these unknowns, this set of cross-sectional analyses was based on baseline structural magnetic resonance imaging (MRI) data from the National Consortium on Alcohol and NeuroDevelopment in Adolescence (NCANDA), which used an accelerated longitudinal design in recruitment of 2 adolescent cohorts, no-to-low drinking youth and moderate-to-heavy drinking youth, to establish normal growth trajectories and identify deviations from those trajectories potentially evident in the heavy-drinking youth (Brown et al. 2015). The current analysis had 4 aims:
1) to examine age-related differences in regional cortical volume, surface area, and thickness and regional white matter volumes in a large, ethnically diverse group of healthy, male and female participants who spanned the adolescent age range (12–21 years);
2) to identify sex and ethnicity differences in age-dependent patterns measured by the MRI metrics;
3) to compare age-dependent patterns of regional cortical volume and thickness identified in this NCANDA sample with those observed in another large-scale sample, namely, the Pediatric Imaging, Neurocognition, and Genetics (PING) study (Bartsch et al. 2014); and
4) to test whether developmental patterns of gray matter or white matter volume, cortical surface area, or cortical thickness were different in healthy adolescents who had initiated moderate-to-heavy drinking relative to the primary NCANDA sample who were no or low alcohol-consuming adolescents.
Expanding on these aims, we examined potential sources, especially global brain size, of sex and ethnicity differences in age-dependent growth patterns. We also investigated the role of scanner differences in multisite studies (Bartsch et al. 2014; Cannon et al. 2014). Spatial integrity of the data was assured by minimizing morphological scaling variability using the Alzheimer's disease neuroimaging initiative (ADNI) phantom-derived volume scalar metrics. Further considered were the roles of socioeconomic status (SES) (Noble et al. 2012) and pubertal development as contributors to age-dependent patterns (Blakemore et al. 2010; Sullivan et al. 2011). We explored alcohol and drug consumption variables as correlates of brain metrics in the moderate-to-heavy drinking youth. Finally, we quantified the incidence of clinically identified abnormalities in this healthy adolescent sample. Critically, all MRI studies were read by a clinical neuroradiologist for detection of structural abnormalities requiring clinical follow-up and for identification of structural anomalies considered normal variants but precluding automated segmentation, parcellation, and quantification.
Methods
Participants
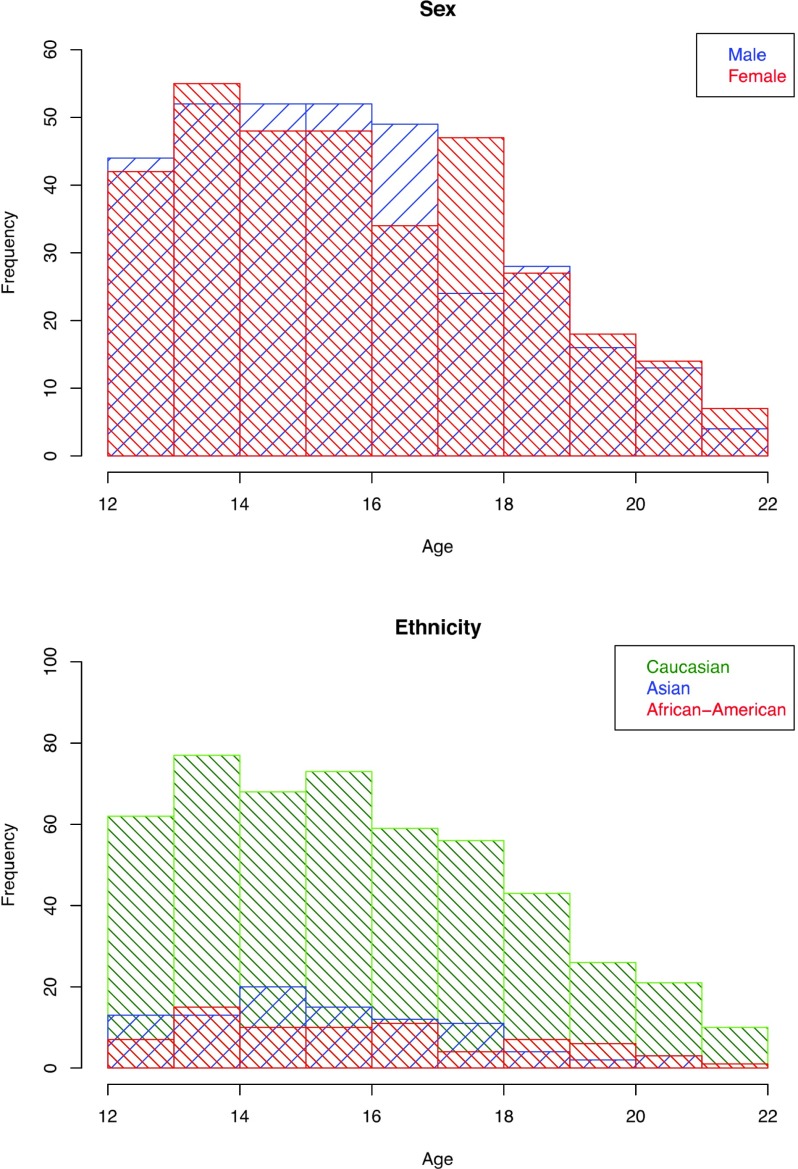
The primary set of analyses focused on MRI data acquired across the 5 NCANDA recruitment sites (University of California at San Diego, SRI International, Duke University Medical Center, University of Pittsburgh Medical Center, and Oregon Health and Science University) in 334 male and 340 female adolescents, aged 12–21.9 years old (Table 1 and Fig. 1, top) who met basic alcohol and drug use criteria for no/low exposure in the NCANDA study (Brown et al. 2015). Briefly, sliding age-dependent scales were employed for lifetime days drinking, cigarette, marijuana, and other drug use and maximum drinks per occasion by sex (see Supplementary Table 1). This group of 674 youth was drawn from the larger group of 831 adolescents with useable T1-weighted MRI data that included 134 adolescents who had initiated moderate-to-high alcohol consumption (exceeds-criteria group). Of the 134 youth in the group exceeding criteria for alcohol use, 9 met criteria for DSM-IV Alcohol Abuse, but none met for Dependence.
Table 1.
NCANDA MRI group demographics
| No/low drinker (N = 674) |
Exceeds-criteria drinker (N = 134) |
MRI anomalies (N = 25) |
||||
|---|---|---|---|---|---|---|
| Male | Female | Male | Female | Male | Female | |
| N | 334 | 340 | 63 | 71 | 12 | 13 |
| Age (years) | ||||||
| Mean | 15.6 | 15.8 | 18.5 | 18.7 | 16.2 | 15.9 |
| SD | 2.3 | 2.4 | 2.0 | 1.9 | 1.6 | 1.9 |
| N | 334 | 340 | 63 | 71 | 12 | 13 |
| Education (years) | ||||||
| Mean | 8.9 | 9.2 | 11.7 | 12.0 | 9.5 | 9.2 |
| SD | 2.3 | 2.5 | 1.9 | 1.9 | 1.5 | 2.1 |
| N | 333 | 338 | 63 | 70 | 11 | 13 |
| Pubertal development scale | ||||||
| Mean | 2.9 | 3.4 | 3.5 | 3.8 | 3.0 | 3.4 |
| Median | 3.0 | 3.6 | 3.6 | 4.0 | 3.2 | 3.6 |
| SD | 0.7 | 0.6 | 0.5 | 0.2 | 0.6 | 0.4 |
| N | 329 | 337 | 62 | 69 | 11 | 13 |
| Socioeconomic status | ||||||
| Mean | 17.0 | 16.6 | 17.2 | 17.1 | 16.1 | 18.2 |
| SD | 2.4 | 2.5 | 2.1 | 2.3 | 2.5 | 2.3 |
| N | 316 | 318 | 53 | 54 | 12 | 12 |
| Handedness | ||||||
| L/R/A | 31/254/49 | 20/286/34 | 2/52/9 | 6/58/7 | 2/9/1 | 4/8/1 |
| N | 334 | 340 | 63 | 71 | 12 | 13 |
| Family history of alcoholism | ||||||
| Negative/positive | 309/25 | 310/30 | 49/14 | 60/11 | 11/1 | 9/3 |
| Body mass index percentile | ||||||
| Mean | 56.5 | 60.4 | 58.8 | 52.3 | 56.9 | 65.4 |
| SD | 29.8 | 27.8 | 26.6 | 24.9 | 33.9 | 28.8 |
| N | 330 | 337 | 61 | 71 | 12 | 12 |
| Self-declared ethnicity | ||||||
| N | 334 | 340 | 63 | 71 | 12 | 13 |
| Caucasian | 245 | 230 | 51 | 55 | 8 | 8 |
| African American | 32 | 52 | 3 | 9 | 2 | 1 |
| Asian | 27 | 25 | 6 | 4 | 0 | 0 |
| Pacific Islander | 1 | 3 | 0 | 0 | 0 | 0 |
| American Indian | 3 | 0 | 0 | 0 | 0 | 0 |
| Mixed | 26 | 30 | 3 | 3 | 2 | 4 |
Figure 1.
Top: Frequency by age of male (blue) and female (red) participants from age 12 to 21.9 years who had an adequate MRI study and met exposure criteria for no-to-low alcohol and drug consumption (N = 674). Bottom: Frequency of ethnicity representation of the participants.
Neuroradiological review identified 25 participants who had structural anomalies sufficient to preclude automated analyses; 2 participants with structural abnormalities requiring clinical referral were excluded from the study, reducing the sample size to 831 and then to 808 for automated analysis (Table 2).
Table 2.
Frequency and type of anomalies identified on readings by a clinical neuroradiologist
| Count | Reading | Excluded from automated analysis |
|---|---|---|
| 24 | Mega cisterna magna | |
| 15 | Subarachnoid cysts (primarily temporal and frontal) | 14 |
| 12 | Pineal cysts | |
| 11 | White matter anomalies and corpus cysts | 3 |
| 5 | Tonsilar ectopias | |
| 5 | Very prominent perivascular spaces | |
| 5 | Gray matter heterotopias | 3 |
| 4 | Pituitary masses (primarily cysts) | |
| 4 | Abnormally large or asymmetrical lateral ventricles | 1 |
| 4 | Cavum septum pellucidum | |
| 3 | Developmental venous anomalies (DVA) | 1 |
| 1 | Severe cranio-cervical junction stenosis (10 mm) | 1 |
| 1 | Right parietal cortical mass (3 cm)a | 1 |
| 1 | Bilateral tonsillar herniation with medullary distortion (Chiari 1 malformation)a | 1 |
Note: N = 95/833, yielding 11.4% incidence.
aAfter referral for clinical follow-up by collection site investigators, excluded from study.
All youth participated in an informed consent process with a research associate trained in human subject research protocols. Adult participants or the parents of minor participants provided written informed consent before entering in the study. Minor youth provided assent before participation. The Internal Review Boards of each site approved this study, and each site followed this procedure to obtain voluntary informed consent or assent, depending on the age of the participant.
Participants were characterized by age, sex, pubertal stage using the self-assessment Pubertal Development Scale (PDS) (Shirtcliff et al. 2009), SES determined as the highest education achieved by either parent (Akshoomoff et al. 2014), and ethnicity (Table 1). Most subjects reported a single self-identified ethnicity (Caucasian, African American, Asian, Pacific Islander, and Native American) with some reporting dual heritage. There were adequate numbers of the first 3 types to assign categorical ethnicity with dual-heritage identifications assigned to the minority ethnicity group (e.g., Asian Caucasian was categorized as Asian) (Fig. 1, bottom).
To examine the generalizability of our sample to another published and publically available sample, we compared the NCANDA and PING cohorts, where the latter sample comprised 570 male and 538 female participants, aged 3–22 years (Fjell et al. 2012; Bartsch et al. 2014) (pingstudy.ucsd.edu) (Jernigan et al. 2015).
MRI Acquisition and Analysis
T1-weighted, 3D images were collected on 833 adolescents in the sagittal plane on systems from 2 manufacturers (mfg): 3T General Electric (GE) Discovery MR750 at 3 sites (216 from UCSD; 166 from SRI; 176 from Duke) and 3T Siemens TIM TRIO scanners at 2 sites (125 from University of Pittsburgh; 150 from Oregon Health and Sciences University). The GE sites used an Array Spatial Sensitivity Encoding Technique (ASSET) for parallel and accelerated imaging with an 8-channel head coil and acquired an Inversion Recovery-SPoiled Gradient Recalled (IR-SPGR) echo sequence (TR = 5.904 ms, TI = 400 ms, TE = 1.932 ms, flip angle = 11°, NEX = 1, matrix = 256 × 256, FOV = 24 cm, slice dimensions = 1.2 × 0.9375 × 0.9375 mm, 146 slices). The Siemens sites used a 12-channel head coil and parallel imaging and temporal acceleration with iPAT and acquired an MPRAGE sequence (TR = 1900 ms, TI = 900 ms, TE = 2.92 ms, flip angle = 9°, NEX = 1, matrix = 256 × 256, FOV = 24 cm, slice dimensions = 1.2 × 0.9375 × 0.9375 mm, 160 slices). Each site scanned the ADNI phantom on each day that participants were scanned (http://adni.loni.usc.edu/methods/mri-analysis/mri-pre-processing/).
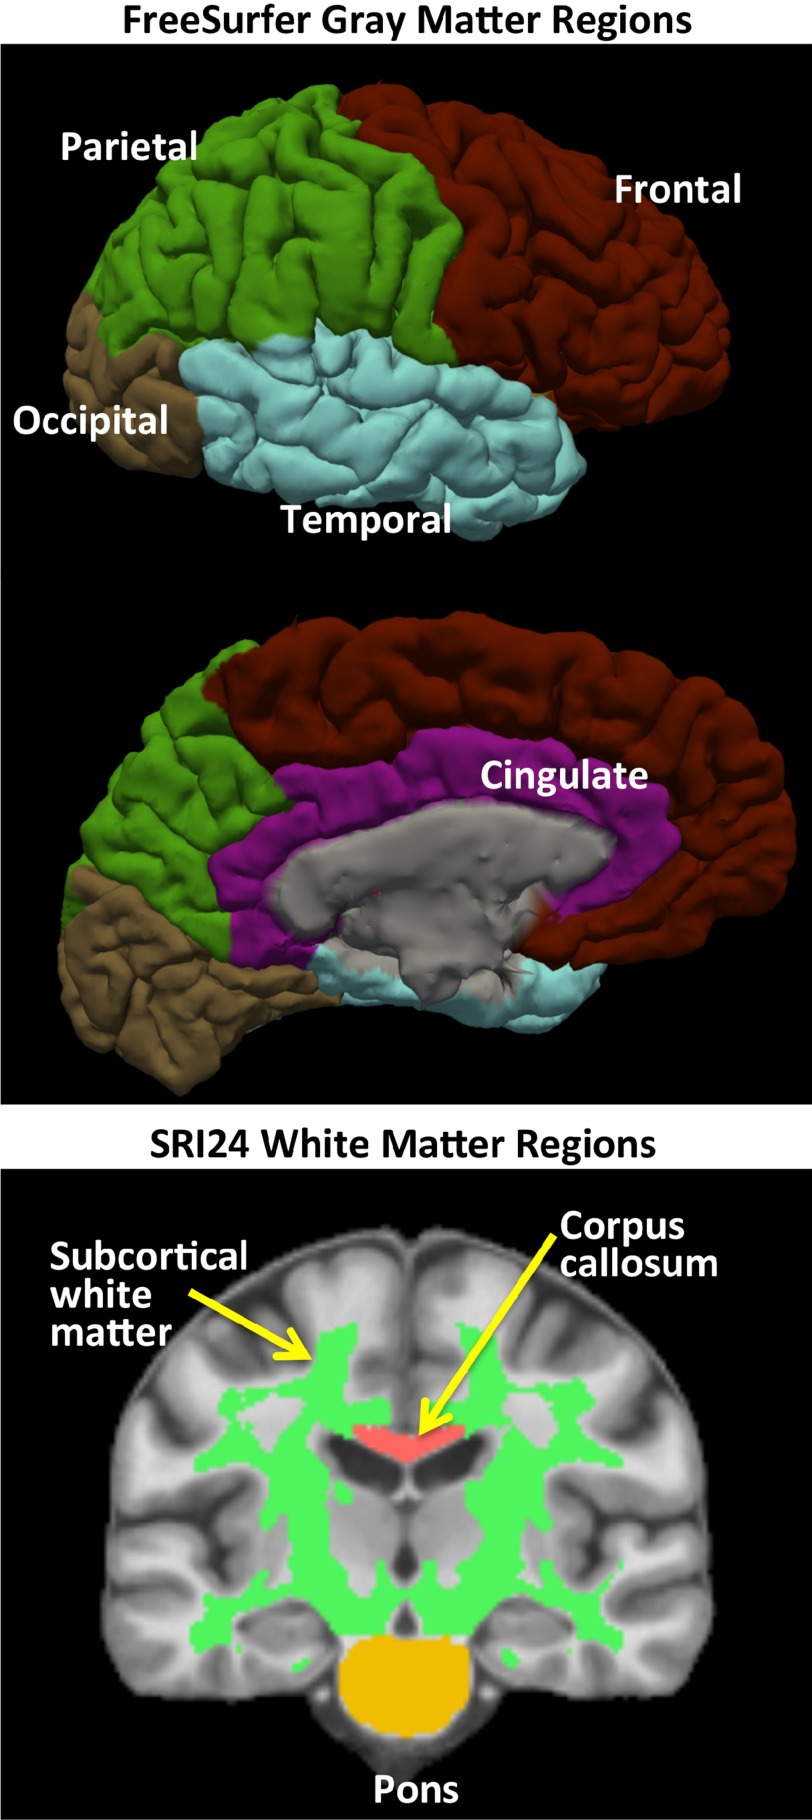
Analysis proceeded via the Biomedical Informatics Technology for Imaging Studies procedure (Rohlfing et al. 2014; Nichols and Pohl 2015) (see Supplementary Information) and involved skull stripping, which was the result of majority voting (Rohlfing et al. 2004) applied to the maps extracted by the Robust Brain Extraction (ROBEX) method (Iglesias et al. 2011) and FSL BET (Smith 2002). The SRI24 atlas-based analysis pipeline (Rohlfing et al. 2010, 2014) was used to identify intracranial volume (ICV), supratentorial volume (svol), and pons, corpus callosum, subcortical white matter (including the centrum semiovale), and lateral ventricular volumes (Fig. 2). FreeSurfer (Dale et al. 1999) was used on skull-stripped data to create bilateral surface area, volume, and thickness of frontal, temporal, parietal, occipital, cingulate cortices derived from the Desikan–Killiany regions-of-interest (ROIs) scheme (Desikan et al. 2006) (surfer.nmr.mgh.harvard.edu/fswiki/CorticalParcellation) plus the insular cortex (Fig. 2). Volume was expressed in cc, surface area in cm2, and thickness in mm. Of the data from the 808 participants reported here, 805 had ADNI phantom data. Global scaling was obtained by affine registration between detected sphere centers and their ideal location. Computed absolute x, y, z scalar deviation (+ or −) from the standard was <1.0% for 618 subjects, 1.0–1.5% for 178 subjects, and 1.5–1.64% for 9 subjects. Therefore, all ROIs were adjusted for linear scaling factors from the ADNI phantom (Clarkson et al. 2009; Gunter et al. 2009).
Figure 2.
Top pair of images: FreeSurfer-derived gray matter regions quantified in terms of volume, surface area, and cortical thickness. Bottom image: SRI24 white matter regions quantified volumetrically.
Statistical Analysis
The primary analysis tools were the General Additive Model (GAM) (Hastie and Tibshirani 1986, 1990; Wood 2006, 2011) and analysis of variance (ANOVA) from the “mgcv” package in R Version 3.1.0 (http://www.r-project.org/), testing for the predictive value of the main effect of age with selective covariates. Additional analyses used general linear model (GLM) and Pearson correlations. The initial GAM (Model 1) tested the predictive value of age and 4 covariates—manufacturer (mfg), ethnicity, SES, and sex—on each brain metric.
Subsequent GAMs included svol as a covariate or PDS as an independent variable.
Values of many of the dependent brain measures were modulated by several or all covariates. Therefore, the contributions of the covariates were examined in a stepwise manner with submodels excluding various covariates and categorical predictions. For graphical purposes for each model describing the no/low drinkers, the adjusted value for each participant minus the influence of covariates was plotted as a function of age, that is, the adjusted value equaled the original value minus all elements of the model except age. For the exceeds plots, age (in addition to the remaining covariates) was removed. The sample sizes vary slightly across models tested, because 26 of the 674 no/low exposure participants and 27 of the 134 in the exceed criteria did not have data for a particular covariate. Each model is presented with its results.
Results
Incidence of Incidental Findings on Clinical Neuroradiological Readings
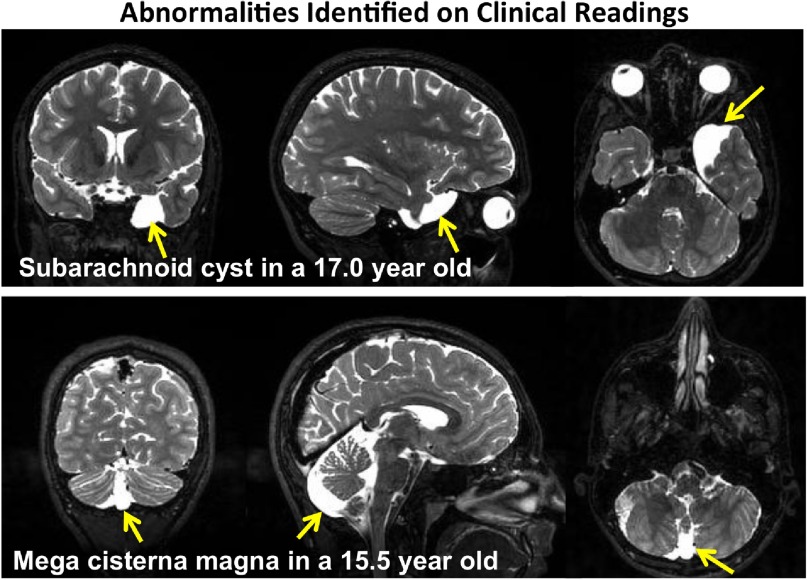
A clinical neuroradiology professor (B.L.) read all MRI studies in search of structural anomalies that would require clinical follow-up outside the purview of the research study or that would preclude automated segmentation or parcellation. Of the 833 MRIs read, one or more anomalies were identified in 95 individuals (Table 2), especially notable was the large number of participants with mega cisterna magna and subarachnoid cysts (Fig. 3). Three adolescents referred for clinical neurological or neurosurgical consultation had the following: severe cranio-cervical junction stenosis (10 mm, normal is 30 mm), right parietal cortical mass (3 cm), and bilateral tonsillar herniation with medullary distortion (Chiari 1 malformation); the latter 2 were excluded from the NCANDA sample. The anomalies identified in an additional 23 individuals were considered large enough to preclude automated segmentation/parcellation and were excluded from the primary imaging analyses of 808 participants.
Figure 3.
Structural anomalies identified on readings by a clinical neuroradiologist. Top: Coronal, sagittal, and axial images showing a large subarachnoid cyst (bright white region) at the temporal pole of a 17-year-old girl. Bottom: Coronal, sagittal, and axial images showing a mega cisterna magna (bright white region) in the area of the cerebellar vermis of a 15.5-year-old boy.
Ventricular Volume Variability in Adolescence
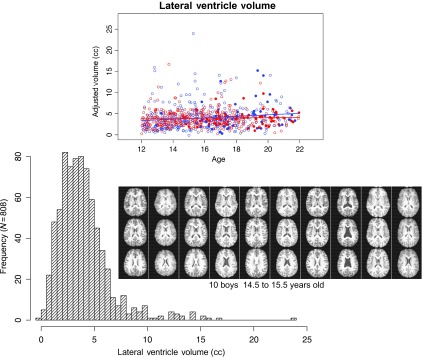
Visual inspection of native images of the 808 individuals in the primary analysis revealed a wide range of lateral ventricular size (Fig. 4A). Automated quantification of ventricular volumes (after controlling for a variety of potential contributing factors, including mfg, ethnicity, SES, and svol) revealed a non-normal distribution from barely detectable to >20 cc volume, with an average of <5 cc for an individual (Fig. 4B). Although ventricular size is a common metric of brain imaging studies of adult neuropathology, its natural variance limits it as a useful metric for examining cross-sectional adolescent age-related differences in brain morphology.
Figure 4.
(A) Scatterplots of the lateral ventricle volumes of 674 no/low drinking boys (blue open circles and blue regression line) and girls (red open circles and red regression line) and 134 exceeds-criteria boys (filled blue circles) and girls (filled red circles) plotted over age. (B) Frequency of lateral ventricular volume (cc) of the 808 participants in the primary analysis. Inset: Examples of variability of ventricular size in 10 boys, age 14.5 to 15.5 years old. For each boy, 3 axial slices display the lateral ventricles, from inferior (top) to superior (bottom), appear as black in the middle of the brain.
NCANDA Sample of No/Low Alcohol Use Adolescents: N = 674
For each set of analyses, the MRI metrics were cortical gray matter volume, thickness, and surface area and white matter volume. The statistical tests and results of the following descriptive comparisons are presented in the accompanying figures and tables.
Age
The initial GAM (Model 1) tested the predictive value on each brain metric of age, mfg, and 3 demographic covariates: ethnicity, SES, and sex.
All but parietal lobe thickness, frontal surface area, and cingulate surface area showed manufacturer effects; that is, scanner differences had substantial effects on most of the brain measures. All volume and surface area measures for gray and white matter, but no thickness measures, had significant sex effects, where girls had smaller values than boys. Significant ethnicity effects were limited primarily to volume and surface area, with the 2 minority groups (Asian and African American) being smaller than the majority group (Caucasian). Similarly, significant SES effects were also evident in volume and surface area, although the SES effects were much smaller than the effects of manufacturer, ethnicity, and sex.
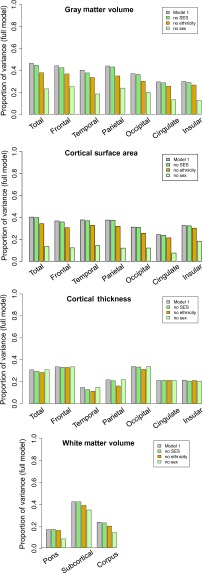
Model 1 tested the value of age and 4 covariates in predicting each brain measure. Presented in Figure 5 is the proportion of variance accounted for by the full model (gray) with SES (green), ethnicity (gold), or sex (light green) removed from the model. The difference between the value of the full model and that of the model without each of the demographic covariates is a measure of the contribution of each covariate. Sex had a major and ethnicity had a lesser contribution to volume and surface area but not thickness measures (Fig. 5). SES consistently accounted for the least variance in the model.
Figure 5.
Results of the initial GAM (Model 1), which tested the predictive value on each brain metric of age, manufacturer (mfg), and 3 demographic covariates: SES, ethnicity, and sex. Presented here are the proportion of variance accounted for by the Model 1 (gray), this model with SES removed (green), ethnicity removed (gold), and the sex removed (light green) in cortical volume (top), surface area (second), cortical thickness (third), and white matter volume (bottom). The amount of variance accounted for by any covariate is determined by subtracting its contribution from that of the full model; thus, the greater the contribution of a covariate, the greater the difference from the full model.
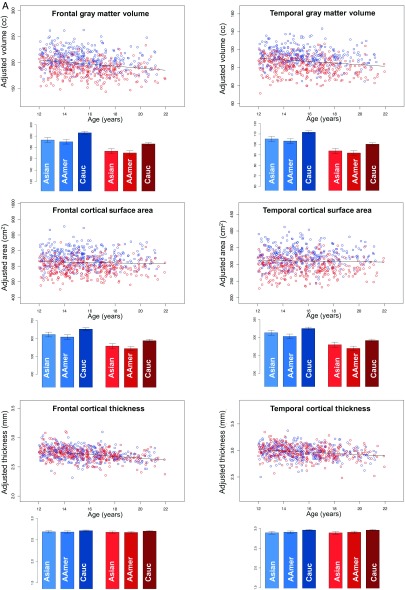
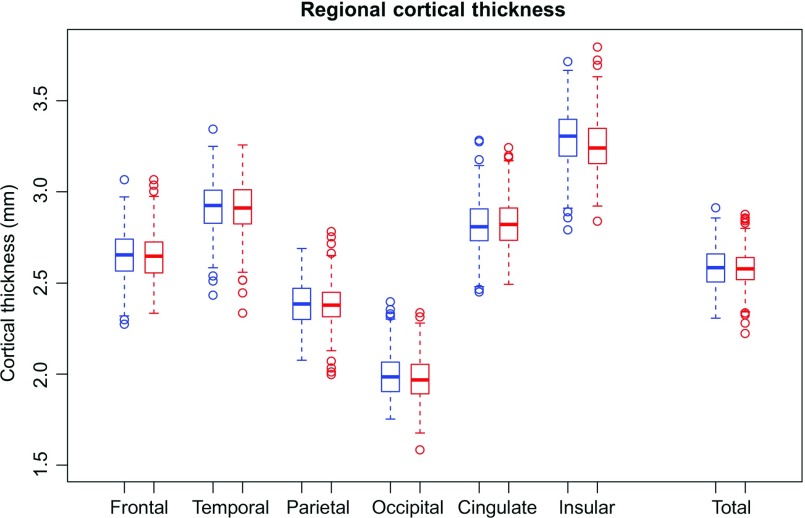
The substantial influence of sex on volume and surface area but not thickness measures can also be seen in Figure 6A, where sex was not included in the predictive model, which was based on age plus manufacturer, ethnicity, and SES. The bar graphs are the predicted value for a 16-year-old boy (blue) or girl (red) derived from full Model 1, thus displaying 3 potential ethnicity differences. For volume and surface, both sex and ethnicity effects are readily apparent, whereas both are minimal for cortical thickness. The variability across cortical lobes and the further absence of sex effects on cortical thickness across all regions is demonstrated in Figure 7.
Figure 6.
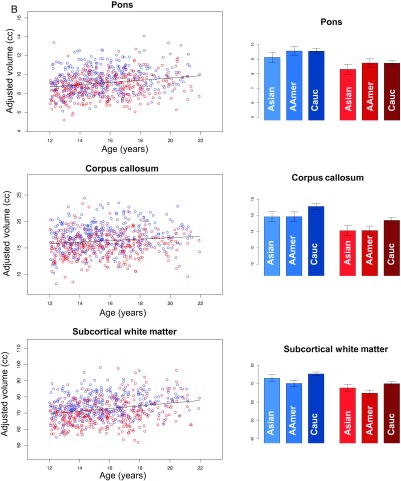
(A) Scatterplots: Cortical frontal (left panel) and temporal (right panel) volumes (top pair), cortical surface area (middle pair), and thickness (bottom pair) of male (blue) and female (red) participants. Bar graphs: Predicted values for 16-year-old male (blue) and female (red) participants grouped by ethnicity. The scatterplots of all brain metrics are covaried for manufacturer, SES, and ethnicity but not supratentorial volume (svol) and therefore demonstrate sex differences in volume and surface area metrics but not in cortical thickness. The data in the bar graphs are not adjusted for ethnicity and therefore demonstrate ethnicity-related differences where present, that is, in cortical volume and surface area but not thickness. (B) Scatterplots: Volumes (adjusted for manufacturer, ethnicity, and SES) of the pons, corpus callosum, and subcortical white matter of male (blue) and female (red) participants. Older adolescents have larger white matter volumes than younger ones. Bar graphs: Same as scatterplots with the male (blue) and female (red) participants grouped by ethnicity.
Figure 7.
Box plots: Thickness of the 6 cortical regions and the total cortex (male = blue; female = red). The measures are adjusted for manufacturer, ethnicity, and SES but not supratentorial volume (svol) and show the absence of sex differences in regional cortical thickness even without adjustment for svol.
In contrast with gray matter volumes, white matter volumes were larger in the older than in the younger adolescents. The sex and ethnicity effects, however, showed the same pattern as the gray matter volumes, where the volumes of the boys were larger than those of the girls, and the Caucasian group had larger volumes than either the African American or Asian groups (Fig. 6B).
Supratentorial Volume
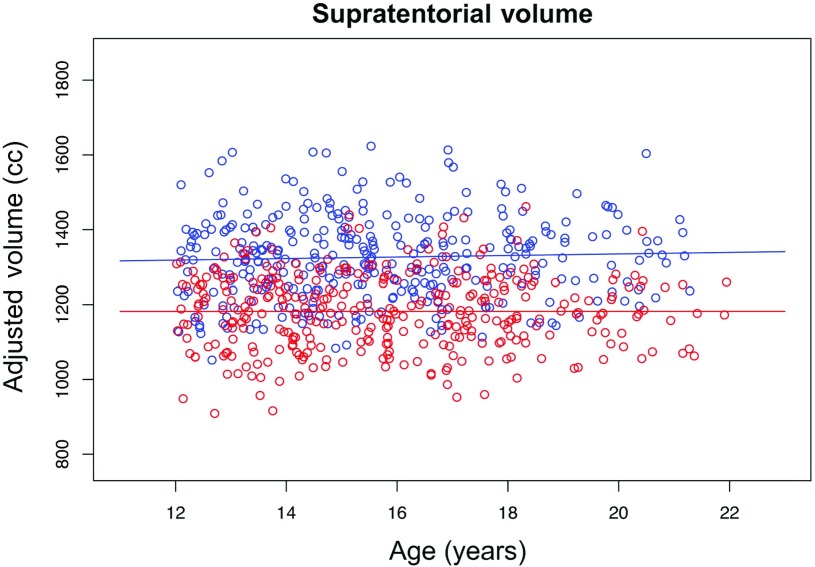
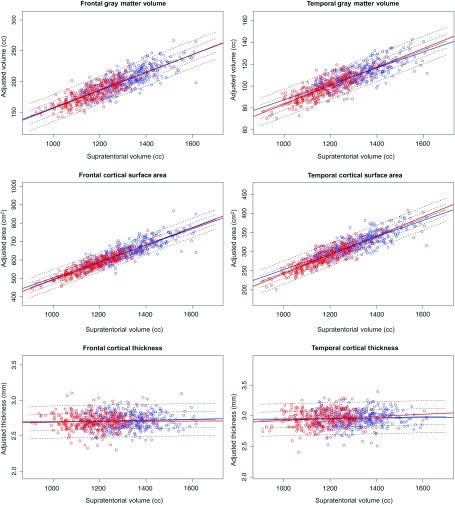
On average, the svol of the male participants was 1320 cc and for the female participants was 1178 cc (t = 17.47, P = 0.0000), and there was no evidence of age-related differences in brain size (R2 = −0.0002, P = 0.93, Fig. 8). Similarly, the MRI regional measures of volume and surface area were larger in male than in female participants. After accounting only for mfg difference, regional gray matter volumes and surface areas, but not cortical thickness, were highly correlated with svol (Fig. 9).
Figure 8.
Scatterplot of supratentorial volumes (svol), which are larger in male (blue) than in female (red) participants, but the volumes do not show a relation with age.
Figure 9.
Scatterplots of frontal (left panel) and temporal (right panel) volume, surface area, and thickness as a function of supratentorial volume (svol). Cortical volume and surface area but not thickness were strongly related to svol in male (blue) and female (red) participants.
To assess the contribution of svol on brain measures, svol was substituted for sex in Model 1 (above). Keeping manufacturer, ethnicity, and SES (Model 2) revealed that svol accounted for the majority of the differences between sexes (see Supplementary Fig. 1) and essentially removed the sex differences, as seen in the scatterplots of Supplementary Figure 1A and B.
Expanding the predictive model to include both sex and svol (Model 3) allowed the examination of the separate contributions of sex and ethnicity independent of svol (see Supplementary Fig. 1A and B, bar graphs). Svol removed sex effects and markedly attenuated ethnicity differences on volume and surface area measures but not pons or corpus callosum volume (see Supplementary Fig. 1A and B, bar graphs of predicted values from Model 3 for a 16-year old with a 1250 cc svol, 16 SES, scanned on a GE system plotted by sex and ethnicity).
Pubertal Development Scale
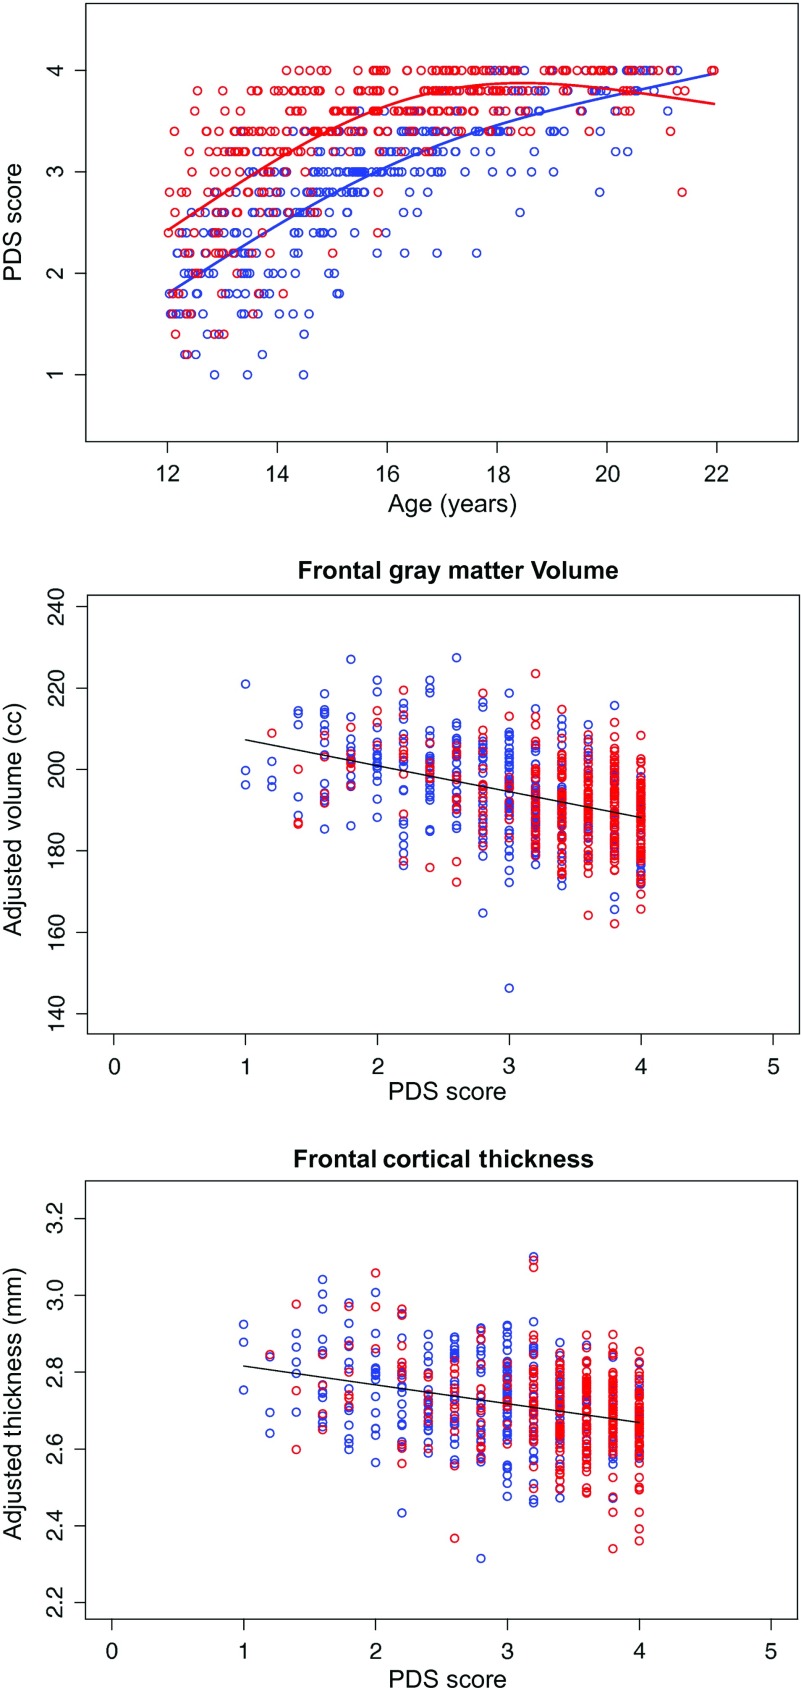
Of the 674 individuals included in the primary analysis, 666 had PDS scores. As would be expected, higher PDS scores were highly correlated with older age in both sexes. These relations were best described by nonlinear functions [thin-plane spline using 3 knots: Model PDS: PDSi ∼ S (agei) + ϵi, male R2 = 0.63, P = 0.0000; female R2 = 0.53, P = 0.0000] (cf., Fjell et al. 2010). The boys started with lower PDS scores than girls at the younger ages, the girls achieved maximum pubertal status, on average, at age 16 years, and the boys did so in their early 20s (Fig. 10). PDS score was then used in place of age as the predictor of regional brain measures (total and frontal cortices and the white matter volumes), covarying for manufacturer, ethnicity, SES, sex, and svol (Fig. 10). Analyses based on PDS scores yielded the same pattern as age-related declines, although not as strong, in gray matter volume and cortical thickness and in greater white matter volumes with more advanced pubertal development.
Figure 10.
Top: Scatterplot of PDS as a function of age in male (blue) and female (red) participants, showing that girls achieved puberty about 4 years earlier than the boys. Frontal gray matter volume (middle) and thickness (bottom) plotted as a function of PDS.
Cross-Sectional Difference Over the Age Range
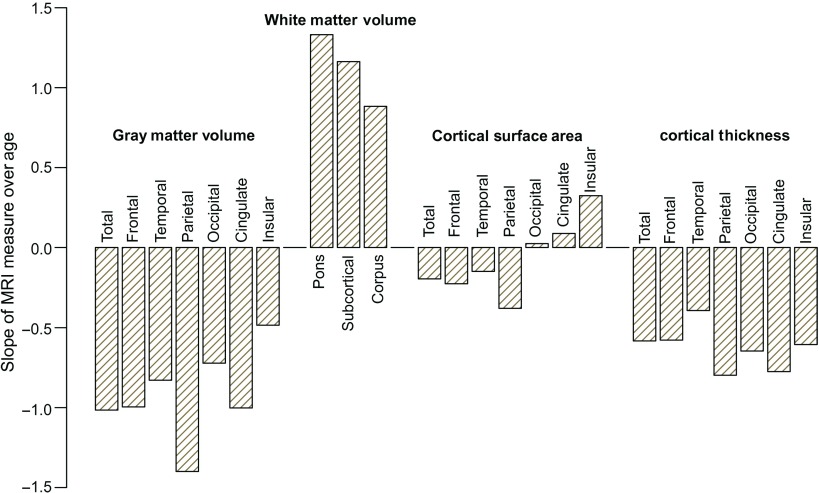
Figure 11 presents the percent difference per year in volume, surface area, and cortical thickness as a function of age. Gray matter volume ranges from −0.5% to −1.4% per year, whereas white matter volume is 0.9% to 1.3%. Surface area differences over age were less than 0.4% with some positive and some negative differences. Thickness ranged from −0.4% to −0.8% per year (Fig. 11).
Figure 11.
Percent difference per year in volume, surface area, and cortical thickness as a function of age.
Comparison of the NCANDA and PING Samples
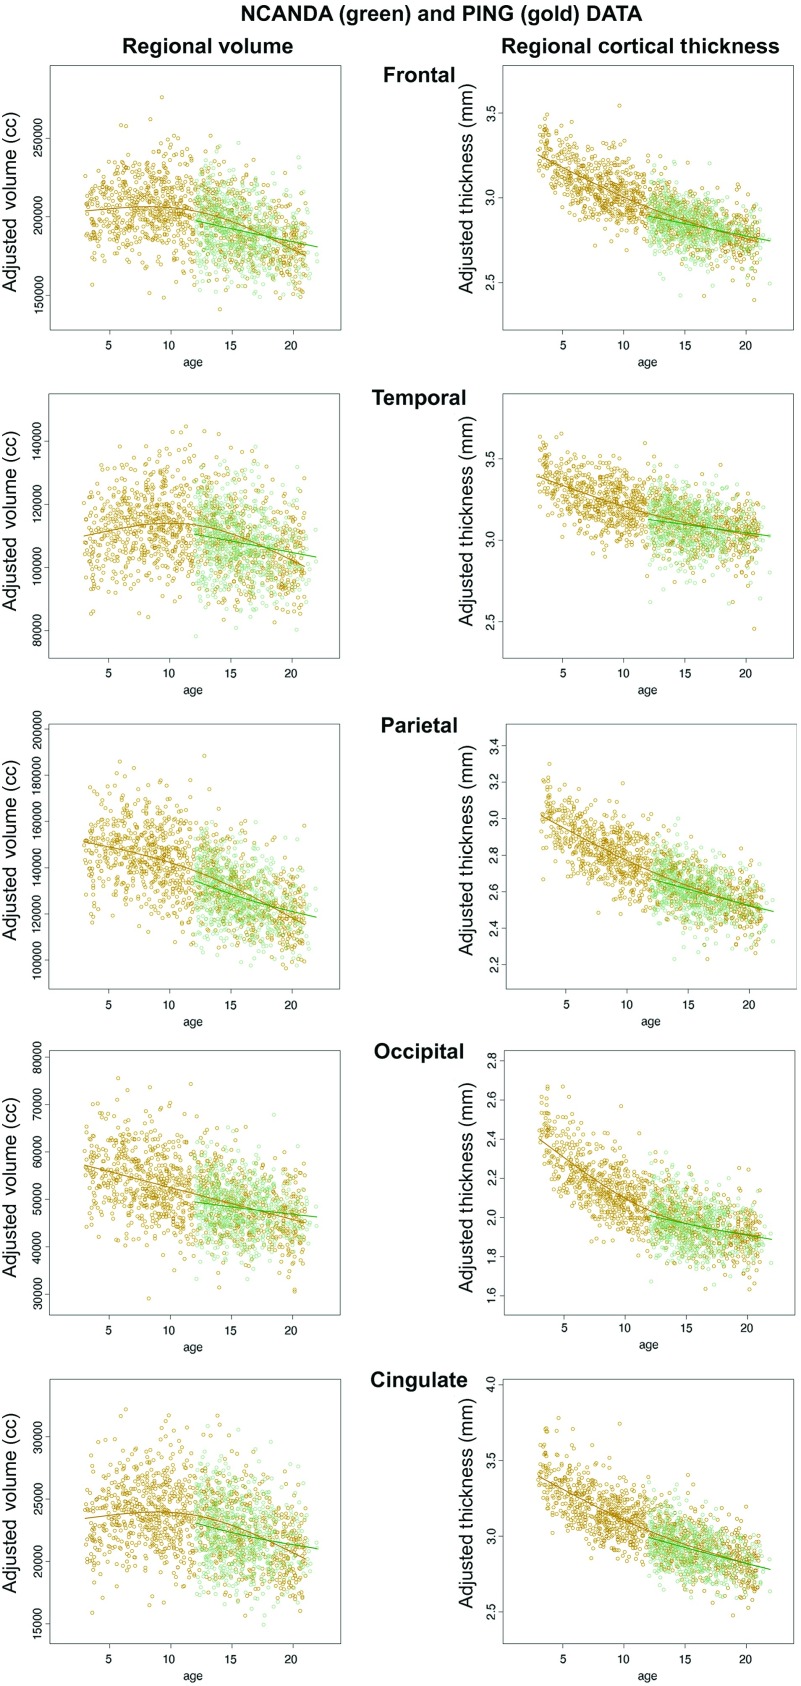
The PING data were downloaded from the PING Data Portal (Bartsch et al. 2014) and analyzed with the same general additive model routines used for the NCANDA data. The dependent measures were FreeSurfer-derived bilateral surface area, volume, and thickness of frontal, temporal, parietal, occipital, and cingulate cortices. To compare the 2 data studies, new sets of data were constructed for each study after controlling for manufacturer, ethnicity, SES, and sex, that is, all the covariates (other than brain size) that were shown to have a significant effect in the prediction models. The adjusted data from the 2 studies were entered into a single analysis for comparison of the effect of age differences.
Before comparing the 2 studies, an additive adjustment in dependent measure level (i.e., the absolute values but not the age contribution) similar to the adjustment for manufacturer was performed to put the 2 data sets on the same scale. The analyses included comparison of the entire PING age range to the NCANDA data and a separate analysis of age-matched samples (PING: 12–21 years of age; 269 male, 255 female). As seen in Figure 12, the full age range of PING data was best fit with a nonlinear function (thin plate spines), whereas the NCANDA data were basically linear even when a nonlinear function was sought. Cortical thickness and supratentorial volume were unrelated in the NCANDA sample, and similarly, only 2 negligible correlations emerged between PING measures of ICV and cortical thickness (occipital cortex, positive, P = 0.0411; cingulum, negative, P = 0.0079). Comparison of the age-related regression and slopes for the age-matched samples (i.e., 12–22 years of age) based on linear fits revealed slightly but statistically significant steeper age-related slopes for the PING than the NCANDA sample, with small, standardized regression coefficient effect sizes from 0.06 to 0.12 (Table 3).
Figure 12.
Scatterplots of regional cortical volumes and thickness (adjusted for manufacturer, ethnicity, SES, and sex) and regression lines of the PING sample (gold) and the NCANDA sample (green). The PING data were better fit with nonlinear functions, whereas the NCANDA data were better fit with linear functions. In both samples, older participants had smaller volumes and thinner cortices than younger participants.
Table 3.
Comparison of NCANDA and PING data related to age in the age-matched samples
| Metric and region of interest | NCANDA low/no exposure sample |
PING sample |
Age × study interaction |
||||||||
|---|---|---|---|---|---|---|---|---|---|---|---|
| R2 | Slope | t | P | R2 | Slope | t | P | t | P | Effect sizea | |
| Gray matter volume | |||||||||||
| Total | 0.0753 | −0.9813 | −7.2561 | 0.00000 | 0.2489 | −1.7421 | −13.1514 | 0.00000 | −4.0172 | 0.00006 | −0.1173 |
| Frontal | 0.0602 | −0.9375 | −6.4388 | 0.00000 | 0.2297 | −1.7490 | −12.4777 | 0.00000 | −4.0105 | 0.00006 | −0.1171 |
| Temporal | 0.0374 | −0.7407 | −5.0168 | 0.00000 | 0.1291 | −1.3865 | −8.7967 | 0.00000 | −3.0014 | 0.00274 | −0.0877 |
| Parietal | 0.1138 | −1.3176 | −9.1131 | 0.00000 | 0.2756 | −2.0727 | −14.0915 | 0.00000 | −3.6663 | 0.00026 | −0.1071 |
| Occipital | 0.0237 | −0.7202 | −3.9616 | 0.00008 | 0.1211 | −1.6605 | −8.4818 | 0.00000 | −3.5344 | 0.00042 | −0.1032 |
| Cingulate | 0.0406 | −0.9843 | −5.2324 | 0.00000 | 0.1605 | −1.7985 | −9.9895 | 0.00000 | −3.1223 | 0.00184 | −0.0912 |
| Cortical surface area | |||||||||||
| Total | 0.0016 | −0.1446 | −1.0297 | 0.30355 | 0.0409 | −0.6338 | −4.7183 | 0.00000 | −2.5134 | 0.01209 | −0.0734 |
| Frontal | 0.0020 | −0.1686 | −1.1398 | 0.25481 | 0.0318 | −0.6060 | −4.1434 | 0.00004 | −2.1024 | 0.03573 | −0.0614 |
| Temporal | 0.0005 | −0.0848 | −0.5464 | 0.58501 | 0.0248 | −0.5886 | −3.6432 | 0.00030 | −2.2543 | 0.02436 | −0.0658 |
| Parietal | 0.0082 | −0.3388 | −2.3135 | 0.02101 | 0.0552 | −0.7802 | −5.5245 | 0.00000 | −2.1670 | 0.03044 | −0.0633 |
| Occipital | 0.0002 | 0.0578 | 0.3541 | 0.72334 | 0.0134 | −0.4811 | −2.6587 | 0.00808 | −2.2243 | 0.02632 | −0.0650 |
| Cingulate | 0.0009 | 0.1523 | 0.7490 | 0.45414 | 0.0145 | −0.5034 | −2.7666 | 0.00587 | −2.3916 | 0.01693 | −0.0699 |
| Cortical thickness | |||||||||||
| Total | 0.1463 | −0.5518 | −10.5285 | 0.00000 | 0.3174 | −0.8564 | −15.5807 | 0.00000 | −4.0230 | 0.00006 | −0.1175 |
| Frontal | 0.1086 | −0.5460 | −8.8792 | 0.00000 | 0.2935 | −0.8913 | −14.7249 | 0.00000 | −4.0006 | 0.00007 | −0.1169 |
| Temporal | 0.0419 | −0.3594 | −5.3187 | 0.00000 | 0.1219 | −0.5631 | −8.5145 | 0.00000 | −2.1538 | 0.03146 | −0.0629 |
| Parietal | 0.1540 | −0.7273 | −10.8520 | 0.00000 | 0.3079 | −0.9682 | −15.2406 | 0.00000 | −2.6045 | 0.00932 | −0.0761 |
| Occipital | 0.0814 | −0.6588 | −7.5706 | 0.00000 | 0.1813 | −0.8992 | −10.7507 | 0.00000 | −1.9886 | 0.04697 | −0.0581 |
| Cingulate | 0.1607 | −0.7606 | −11.1298 | 0.00000 | 0.2600 | −0.9567 | −13.5424 | 0.00000 | −1.9992 | 0.04582 | −0.0584 |
Note: These results describe the data in Figure 12 and are based on linear analysis.
aStandardized regression coefficient effect size.
The Effects of Manufacturer and Other Covariates on MRI Metrics
Using Model 3, we computed the R2 for the full model and determined the contribution of manufacturer to the amount of variance explained, which was significant in all but 4 ROIs. There was no simple scalar factor to resolve differences between Siemens and GE scanners. Each ROI, measurement, and tissue type had a different factor, and the influence of device differences ranged from essentially 0 to >20% of the variance (Table 4). The scanner differences probably were due to differences in gray matter, white matter, CSF conspicuity rather than any global scaling, which was accounted for by the ADNI phantom adjustment.
Table 4.
Effect of scanner manufacturer (mfg) on MRI metrics (N = 648)
| ROI | Full model | Full model without mfg | χ2 | P | Full model-mfg |
|
|---|---|---|---|---|---|---|
| R2 | R2 | Diff | Diff% | |||
| Gray matter volume | ||||||
| Total | 0.8826 | 0.8611 | 0.0000 | *** | 0.0215 | 2.15 |
| Frontal | 0.8074 | 0.7300 | 0.0000 | *** | 0.0774 | 7.74 |
| Temporal | 0.7652 | 0.7601 | 0.0001 | *** | 0.0051 | 0.51 |
| Parietal | 0.8013 | 0.7915 | 0.0000 | *** | 0.0098 | 0.98 |
| Occipital | 0.6182 | 0.5572 | 0.0000 | *** | 0.0610 | 6.10 |
| Cingulate | 0.6978 | 0.6837 | 0.0000 | *** | 0.0141 | 1.41 |
| Insula | 0.5955 | 0.5605 | 0.0000 | *** | 0.0350 | 3.50 |
| Cortical surface area | ||||||
| Total | 0.3081 | 0.1941 | 0.0000 | *** | 0.1140 | 11.40 |
| Frontal | 0.3360 | 0.1335 | 0.0000 | *** | 0.2025 | 20.25 |
| Temporal | 0.1470 | 0.1093 | 0.0000 | *** | 0.0377 | 3.77 |
| Parietal | 0.2192 | 0.2177 | 0.1348 | 0.0015 | 0.15 | |
| Occipital | 0.3454 | 0.1286 | 0.0000 | *** | 0.2168 | 21.68 |
| Cingulate | 0.2407 | 0.1999 | 0.0000 | *** | 0.0408 | 4.08 |
| Insula | 0.2143 | 0.1495 | 0.0000 | *** | 0.0648 | 6.48 |
| Cortical thickness | ||||||
| Total | 0.9029 | 0.8953 | 0.0000 | *** | 0.0076 | 0.76 |
| Frontal | 0.8450 | 0.8451 | 0.6287 | −0.0002 | −0.02 | |
| Temporal | 0.8111 | 0.7831 | 0.0000 | *** | 0.0280 | 2.80 |
| Parietal | 0.8255 | 0.8193 | 0.0000 | *** | 0.0063 | 0.63 |
| Occipital | 0.6117 | 0.5989 | 0.0000 | *** | 0.0128 | 1.28 |
| Cingulate | 0.7170 | 0.7165 | 0.1556 | 0.0004 | 0.04 | |
| Insula | 0.6226 | 0.5245 | 0.0000 | *** | 0.0981 | 9.81 |
| White matter volume | ||||||
| Pons | 0.2922 | 0.2380 | 0.0000 | *** | 0.0543 | 5.43 |
| Centrum semiovale | 0.7260 | 0.5482 | 0.0000 | *** | 0.1778 | 17.78 |
| Corpus | 0.5119 | 0.4289 | 0.0000 | *** | 0.0830 | 8.30 |
Note:
***P ≤ .0001.
There were many significant MRI metric site effects, albeit of small effect sizes. A simple ANOVA of each native MRI metric by site was compared with a similar ANOVA of the MRI metric values after removing the effects of age, sex, ethnicity, SES, and svol (Model 3), that is, GAM residualized values (see Supplementary Table 2). The native data produced site effect sizes ranging from 0.019 to 0.277. By comparison, the effect sizes for the residualized measures ANOVAs were even smaller (0.0005–0.0605) in all but 1 case (temporal lobe volume), which had an effect size of 0.0303 before and 0.0311 after residualization. Controlling for age, sex, ethnicity, SES, and manufacturer essentially removed any site effects of meaningful magnitude.
Comparison of NCANDA Samples: No/Low Versus Exceeds Criteria for Alcohol Consumption
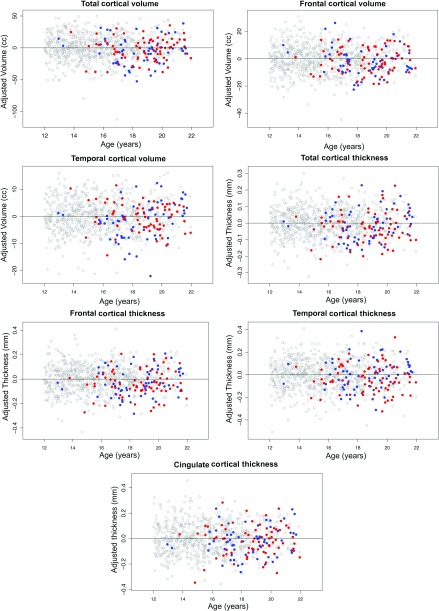
MRI measures of no/low exposure participants were compared with the 134 adolescents in the exceeds criteria for alcohol exposure group using the GAM, covarying for manufacturer, ethnicity, sex, and svol. For all cortical volume and thickness regional measures, the exceeds-criteria group had smaller values than the no/low group. These differences were significant for total, frontal, and temporal gray matter volume and cortical thickness and cingulate thickness (Table 5). All dependent variables revealed a predicted difference with age. To examine sex differences and potential age acceleration effects among the exceeds-criteria group participants, the expected age effects were removed by regression and the resulting data were tested for age and sex effects. Among the exceeds participants, there were no age effects over and above the expected age differences for the entire sample, nor were there any sex differences within the exceeds-criteria groups (Fig. 13 and Table 5)
Table 5.
T-test results by ROI for 674 no/low drinkers vs. 132 exceeds-criteria drinkers
| t | P | |
|---|---|---|
| ROI | ||
| Total | −2.522 | 0.0119 |
| Frontal | −2.63 | 0.0087 |
| Temporal | −1.994 | 0.0464 |
| Parietal | −0.454 | 0.6498 |
| Occipital | −0.704 | 0.4816 |
| Cingulate | −0.471 | 0.6374 |
| Insula | −1.845 | 0.0653 |
| Cortical thickness | ||
| Total | −3.141 | 0.0017 |
| Frontal | −4.144 | 0.0000 |
| Temporal | −2.195 | 0.0285 |
| Parietal | −1.134 | 0.2572 |
| Occipital | −1.009 | 0.3134 |
| Cingulate | −2.519 | 0.0120 |
| Insula | −1.933 | 0.0536 |
Note: Negative t-values indicate deficit in exceed group.
Figure 13.
Regional cortical volume and thickness measures (adjusted for manufacturer, ethnicity, supratentorial volume, and sex) with the effect of age also removed showing differences between the 674 no/low exposure adolescents (open gray circles) and the 134 exceeds-criteria exposure adolescents (filled circles). blue = male; red = female.
Exposure Variables in the Exceeds-Criteria Group
Three exposure variables were tested: number of binges in the past year, lifetime number of drinks, and lifetime marijuana uses. Among the 134 adolescents in the exceeds-criteria group, 113 reported one or more binges in the past year, ranging from 1 to 137 episodes. A GAM, testing the predictive value of age, manufacturer, ethnicity, sex, and svol plus the number of binges in the past year, was conducted for each brain metric among the 134 exceeds-criteria participants. For 2 measures, the number of binges in the previous year made a significant, albeit small, contribution to this model: frontal (t(133) = −2.123, P = 0.0357, standardized regression coefficient effect size = 0.18) and parietal (t(133) = −2.285, P = 0.0240, effect size = 0.20) cortical thickness. Greater number of lifetime drinks was a predictor of smaller central white matter volumes (t = −2.11, P = 0.037) but larger temporal cortical volumes (t = 2.574, P = 0.0112) and thicker insular cortex (t = 2.196, P = 0.0299). Greater number of lifetime marijuana cigarettes was a predictor of smaller central white matter volumes (t = −2.974, P = 0.0035). Surprisingly few adolescents smoked cigarettes. Only 7 participants reported smoking at least once/week and those 7 reported 1–6 cigarettes smoked per day. Marijuana use was more prevalent than cigarette use with 23 participants (6 non/low and 17 exceeds-criteria) reporting use at least once/week.
Discussion
Analysis of baseline MRI data from the NCANDA multisite, longitudinal study revealed significant moderators of age-related, brain tissue differences in gray matter and white matter volume, cortical thickness, and cortical surface area marking adolescent neurodevelopment. Collection site differences had significant effects on all MRI metrics but were minimized or removed altogether with statistical adjustment for manufacturer differences. Despite significant sex and ethnicity differences in measures of cortical volume and surface area unadjusted for normal variation in head size, cortical thickness was invariant with respect to sex and ethnicity in showing similar age-related declining slopes in both male and female adolescents and similar thickness across ethnicities even without adjustment for head size. Investigation of the influences of alcohol consumption variables on age-related brain development indicated smaller regional volumes and thinner cortices in the exceeds-criteria group relative to the no/low alcohol exposure group; a modest relation to the number of binge drinking episodes reported implicates alcohol exposure as exerting an untoward effect on selective developmental trajectories. Critically, the youth exceeding alcohol and drug use criteria were not treatment seeking and did not meet criteria for Alcohol Dependence. Unique strengths of this study include the careful screening of volunteers for medical, psychiatric, and substance use history; clinical neuroradiological readings for identification of anomalous structure that could interfere with automated quantification of the primary brain metrics; and phantom and statistical adjustment for scanner and site differences. Indeed, the use of the GAM to adjust for signal differences across sites and manufacturers enabled a unique quantitative comparison of 2 large cohorts of adolescents (NCANDA and PING), representative of the USA in terms of sex and ethnicity (Brown et al. 2015).
Clinical Readings and Ventricular Size
Noninvasive neuroimaging has emerged as an essential research tool for examining the human brain in health and disease, but its role in medical diagnosis should also be an essential consideration in structural brain imaging research (Illes et al. 2006). Studies in which research MRI were read by clinical neuroradiologists report about 8–12% anomalies in adolescents who were deemed healthy and passed study entry criteria (Kim et al. 2002; Illes et al. 2004; Morris et al. 2009; Reneman et al. 2012; Gur et al. 2013). Not surprisingly, this incidence rate varies with the recruitment base; thus, rates of anomalies identified are substantially higher in youth drawn from hospital settings (Gupta and Belay 2008; Whitehead et al. 2013) than from research protocols with rigorous medical screening (Gur et al. 2013). The incidence of structural anomalies in our highly screened, NCANDA sample (Brown et al. 2015) was 11.4% (95 of 833 adolescents). Of these, 2 youths were removed from the study and referred for clinical neurological or neurosurgical consultation. These anomalies would likely have gone undetected if their research scans had not been read clinically. Benign anomalies with the highest incidence were mega cisterna magna and subarachnoid cysts, typically in the temporal or frontal poles. The 23 cases remaining in the NCANDA sample that had anomalies precluding automated analysis will be followed, and their MRI data will ultimately be analyzed with methods that are robust to the identified anomalies with the objective of tracking their developmental trajectories in relation to the adolescents who were without such anomalies.
Clinical readings identified 4 adolescents with abnormally large or asymmetrical ventricles, but only one of these cases was excluded from automated analysis. Although ventricular size is a common metric in brain imaging studies of adult neuropathology (DeCarli et al. 1992; Nestor et al. 2008; Pitel et al. 2010; Madsen et al. 2015), its natural non-normal distribution would appear to limit it as a useful metric for identifying or distinguishing normal from abnormal adolescent age-related differences in brain morphology.
Age-Related Differences in Tissue Volume, Cortical Surface Area, and Cortical Thickness
Across the adolescent age range, both total cortical thickness and volume, but neither cortical surface area nor supratentorial brain volume, were significantly smaller in older than in younger, male and female adolescents. Cortical volume exhibited an age-related decline of 0.5–1% per year, and cortical thickness declined by 0.3–0.7% per year. A similar pattern was present for most of the cortical lobe measures, with supratentorial volume, for example, accounting for 65% of the variance in total cortical volumes, covarying for manufacturer, ethnicity, and SES. In contrast, supratentorial volume accounted for only a negligible proportion of cortical thickness variance (0–2.6%). These age-related differences showing declining cortical volume and thickness across adolescence comport with earlier studies of youth spanning this age range (for reviews, Giedd et al. 2010; Giedd et al. 2014). Unlike previous reports (Gogtay et al. 2004; Sowell, Thompson, Leonard, et al. 2004), however, there was not a consistent posterior-to-frontal gradient for either cortical volume or thickness. Considering the 2 allocortical regions, the cingulate cortex showed greater age-dependent volume and thickness slopes and lesser surface area expansion than the insula.
Whereas the age effects in cortical gray matter indicated smaller volumes and thickness in older than in younger adolescents, the subcortical white matter volume and corpus callosum showed the opposite effect, indicative of continued growth over adolescence and consistent with postmortem series (Yakovlev and Lecours 1967) and longitudinal MRI studies (Sowell, Thompson, Leonard, et al. 2004; Shaw et al. 2008; Pfefferbaum et al. 2013). White matter volume was positively correlated with age, suggesting 0.9–1.3% per year enlargement of the different structures in older relative to young adolescents. White matter expansion is speculated to provide greater connectivity across the cortex as it undergoes maturational modeling with environmental experience (Paus et al. 2001; Fields 2008; Zatorre et al. 2012; Giedd et al. 2014). In addition, SES, reported to have small but significant effects on many measures (Noble et al. 2012, 2015; Lawson et al. 2013), was removed in the current study when used as a covariate.
MRI manufacturer type affected most measures and was statistically removed using the GAM (Bartsch et al. 2014). As an additional control for manufacturer and scanner drift, ADNI phantom data were collected at every site on each day when one or more NCANDA participants were studied, and data were available on essentially all participants. The spatial integrity of the data is assured by minimizing morphological scaling variability using the ADNI phantom-derived volume scalar metrics.
Relation of Sex and Ethnicity to MRI Metrics
As was expected, girls had smaller total cortical volume and surface area than boys (Dekaban and Sadowsky 1978; Goldstein et al. 2001; Lenroot et al. 2007; Sowell et al. 2007; Paus 2010). This sex difference persisted across the adolescent age range, with similar but not as striking effects in most lobar measures. In addition to sex, other factors were found to exert significant effects on brain metrics. Self-identified ethnicity was a significant factor in nearly all volume and surface area brain measures, but its effect was smaller than that of sex, such that the head-size differences between the sexes were substantially greater than this difference among ethnicities. As with sex, ethnicity was not a moderator of cortical thickness (cf., Tobias 1970). Ethnically related differences in brain morphology are known (Bakken et al. 2011; Chee et al. 2011; Fan et al. 2015) and have been the impetus for the development of brain atlases specific to ethnicity ([for example, Chinese: Tang et al. 2010; Luo et al. 2014] and [Japanese: Uchiyama et al. 2013]). Recognition of ethnicity-related morphological differences is essential, for example, for surgical planning (Lee et al. 2008) and in determining normal from pathological variation.
Although age and pubertal development are inextricably linked, the timing of pubertal maturation is substantially earlier in girls than in boys. Thus, consideration of sexual maturity stage provides additional information about sexual dimorphism in the development of brain structure (Giedd et al. 2006; Blakemore et al. 2010; Sullivan et al. 2011). In our sample of 12- to 21-year olds, the girls reached their maximum pubertal status about 4 years earlier than the boys. How this difference related to status of brain development was exemplified in Figure 6, which showed that adolescents with scores reflecting more mature pubertal status had thinner frontal cortices and that most of the more mature adolescents were female. As it was with age, this relation between sexual maturity and cortical thickness was independent of sex differences in supratentorial volume.
Cortical surface area and cortical gray matter volume (after accounting only for manufacturer difference) were each highly correlated with supratentorial brain volume, whereas cortical thickness was not. For the measures of the total cortex, supratentorial volume accounted for 89% of the variance of cortical surface area and 82% of the variance of cortical gray matter volume, but <1% of cortical thickness. The independence of cortical thickness from brain size is consistent with a number of cross-sectional (Hogstrom et al. 2013; McKay et al. 2014) and longitudinal (Schmitt et al. 2014; Storsve et al. 2014) studies, some of which focused on adolescents, whereas others included adults (Sowell et al. 2007; Im et al. 2008). Thus, a potential contributor to differences is likely the age range of the study participants, where some studies would have had greater contribution to aging effects from adult to senescent changes, whereas the results of other studies would have had greater influence from the developmental years of adolescence.
Cortical thickness and cortical area appear to be genetically unrelated (Panizzon et al. 2009; Chen et al. 2013). Consistent with this dissociation, age-related change in cortical thickness was found to correlate with change in volume but not area (Storsve et al. 2014). These relations are also consistent with the characterization of an invariant relation between cortical thickness and other gross measures of cortex expressed by the radial unit hypothesis (Rakic 1995). This hypothesis posits that expansion of the cortex during evolution determined cortical surface area by increasing the number of radial columnar units composing the cortical mantle with greater increases in white matter to enable interconnectivity (Hofman 2014). In contrast, the number of cells within cortical columns remains constant and determines cortical thickness (Rakic 1995, 2009). One speculation is that smaller brains may require less connectivity than larger brains, thereby making them more efficient. Also comporting with the radial unit hypothesis were MRI studies investigating the relation of birth weight to ultimate brain size and finding that cortical surface area and volume but not thickness were affected (Raznahan et al. 2012). This speculation must be taken within the context of regional differences in heritability, where evolutionarily newer, association cortices are more heritable than more posterior regions (Chouinard-Decorte et al. 2014; Schmitt et al. 2014; Storsve et al. 2014).
Comparison of the NCANDA and PING Samples
The comparison of the NCANDA and age-matched PING samples revealed similarities and some differences. Both samples showed negative slopes in the relation of gray matter volumes and thickness over age. The slopes of the PING data, however, were steeper than those of the NCANDA data and in general followed a nonlinear trend rather than the linear trend of the NCANDA group.
Although both MRI data sets were quantified using FreeSurfer algorithms, the samples differed with respect to recruitment strategy, SES definition, and method for genetic classification ([NCANDA: Brown et al. 2015] [PING: Fjell et al. 2012; Walhovd et al. 2012]). For recruitment, NCANDA had 5 sites, a common assessment protocol, and was prospectively enriched for high risk for future alcohol use, an alcohol and marijuana exposure criterion; PING had 9 sites, subjects were not screened for substance use, and many of the 18- to 21-year olds were university students. For ethnicity assignment, NCANDA used self-identification, whereas PING used values derived from genetic ancestry factors (GAF) (Akshoomoff et al. 2014). For SES assignment, NCANDA used highest education achieved by any parent, whereas PING used a combination of parental highest education and family income. Any and all of these sample differences may be responsible for the observed age-dependent differences in slopes. Nonetheless, the use of the GAM to account for differences in manufacturer enabled direct comparison of these large data sets.
Relation of Alcohol and Drug Consumption to Regional Brain Metrics
In this cross-sectional analysis, a few differences emerged between NCANDA participants who met exposure criteria based on no/low exposure limits relative to those who exceed these limits. Adolescents in the exceeds-criteria group, none of whom met diagnostic criteria for Alcohol Dependence, had thinner cortices in frontal, temporal, and cingulate regions and smaller frontal cortical volumes than no/low exposure adolescents. The number of binge drinking episodes over the year prior to study also revealed a small but statistically significant contribution to frontal and parietal cortical thickness. Given that high-risk youths, such as those with externalizing behaviors, have been observed to have thinner orbitofrontal, medial temporal, and retrosplenial cingulate cortices before initiating drinking (Ameis et al. 2014), these brain differences could be pre-existing in the exceed-criteria group.
While suggestive of untoward effects of excessive alcohol consumption on the adolescent brain, cross-sectional comparison of exceeds-criteria drinkers with no/low drinkers cannot address potential pre-existing differences in brain measures and is inadequate for detecting deviations attributable to alcohol consumption in trajectories of brain development. For example, whether the smaller white matter volumes that correlated with number of alcohol drinks and number of marijuana cigarettes smoked is evidence for attenuated growth requires verification with longitudinal study. A recent longitudinal study (Squeglia et al. 2015) was successful in computing trajectories of change over several years during adolescence and found accelerated decline in anterior cortical volumes and attenuated growth of white matter volumes in heavy-drinking youth relative to no/low drinkers. The longitudinal components of the NCANDA study will be poised to characterize the effects of alcohol and other substances on adolescent brain development given the large group examined before initiating substantial alcohol use and to test whether the effects of heavy drinking during the developmental years of adolescence fall on a continuum of consumption variables or are discontinuous falling along the lines of diagnostic classification.
Conclusion
This cross-sectional analysis of the NCANDA baseline data of well-described and screened adolescents revealed age-related differences in regional cortical volume, white matter volume, and cortical surface area, where older adolescents had larger white matter and smaller gray matter values than the younger ones, indicative of development and neuronal pruning. These effects were the same regardless of sex or ethnicity, with the stipulation that these brain tissue metrics of size were adjusted for differences in supratentorial volume. That cortical thickness showed age-related decline and was unrelated to supratentorial volume was consistent with the radial unit hypothesis and suggests a universal characterization of neural development that is robust to sex and ethnicity. The patterns of brain volume, surface area, and cortical thickness measures in relation to age, sex, and ethnicity are largely consistent with those noted in other small-scale and large consortium studies (Fjell et al. 2012; Giedd et al. 2014; Whelan et al. 2014) but also indicate the need to take into account scanner manufacturer, site differences, brain structural anomalies, and general health of the participants in establishing normality and normal developmental changes. Finally, the smaller total, frontal, and temporal cortical volumes and thinner total, frontal, temporal, and cingulate cortices in the moderate-to-high alcohol or drug exposure group compared with the no/low exposure group requires replication with longitudinal study, as will be accomplished with the NCANDA project, which is following this cohort during years when youth typically initiate drinking alcohol. We anticipate that the ensuing longitudinal data will enable determination of developmental trajectories of regional brain structural maturation that may be put off course by hazardous drinking yet carry the promise of recovery with sobriety.
Supplementary Material
Supplementary material can be found at: http://www.cercor.oxfordjournals.org/.
Funding
This work was supported by the U.S. National Institute on Alcohol Abuse and Alcoholism with co-funding from the National Institute on Drug Abuse, the National Institute of Mental Health, and the National Institute of Child Health and Human Development (NCANDA grant numbers: AA021697 to A.P. and K.M.P., AA021695 to S.A.B. and S.F.T., AA021692 to S.A.B. and S.F.T., AA021696 to I.M.C. and F.C.B., AA021681 to M.D.D.B., AA021690 to D.B.C., AA021691 to B.J.N.). PING was supported by the National Institute on Drug Abuse and the National Institute of Child Health and Human Development (RC2DA029475, R01HD061414).
Supplementary Material
Notes
Conflict of Interest: None declared.
References
- Akshoomoff N, Newman E, Thompson WK, McCabe C, Bloss CS, Chang L, Amaral DG, Casey BJ, Ernst TM, Frazier JA et al. . 2014. The NIH Toolbox Cognition Battery: results from a large normative developmental sample (PING). Neuropsychology. 28:1–10. [DOI] [PMC free article] [PubMed] [Google Scholar]
- Ameis SH, Ducharme S, Albaugh MD, Hudziak JJ, Botteron KN, Lepage C, Zhao L, Khundrakpam B, Collins DL, Lerch JP et al. . 2014. Cortical thickness, cortico-amygdalar networks, and externalizing behaviors in healthy children. Biol Psychiatry. 75:65–72. [DOI] [PubMed] [Google Scholar]
- Anderson V, Spencer-Smith M, Wood A. 2011. Do children really recover better? Neurobehavioural plasticity after early brain insult. Brain. 134:2197–2221. [DOI] [PubMed] [Google Scholar]
- Bakken TE, Dale AM, Schork NJ. 2011. A geographic cline of skull and brain morphology among individuals of European Ancestry. Hum Hered. 72:35–44. [DOI] [PMC free article] [PubMed] [Google Scholar]
- Bartsch H, Thompson WK, Jernigan TL, Dale AM. 2014. A web-portal for interactive data exploration, visualization, and hypothesis testing. Front Neuroinformatics. 8:25. [DOI] [PMC free article] [PubMed] [Google Scholar]
- Bava S, Thayer R, Jacobus J, Ward M, Jernigan TL, Tapert SF. 2010. Longitudinal characterization of white matter maturation during adolescence. Brain Res. 1327:38–46. [DOI] [PMC free article] [PubMed] [Google Scholar]
- Blakemore SJ, Burnett S, Dahl RE. 2010. The role of puberty in the developing adolescent brain. Hum Brain Mapp. 31:926–933. [DOI] [PMC free article] [PubMed] [Google Scholar]
- Brown SA, Brumback T, Tomlinson K, Cummins K, Thompson WK, Nagel B, De Bellis MD, Hooper SR, Clark DB, Chung T et al. . 2015. The National Consortium on Alcohol and NeuroDevelopment in Adolescence (NCANDA): characterizing risk and resilience for alcohol use in adolescents. J Stud Alcohol Drugs. in press. [DOI] [PMC free article] [PubMed] [Google Scholar]
- Brown TT, Kuperman JM, Chung Y, Erhart M, McCabe C, Hagler DJ Jr, Venkatraman VK, Akshoomoff N, Amaral DG, Bloss CS et al. . 2012. Neuroanatomical assessment of biological maturity. Curr Biol. 22:1693–1698. [DOI] [PMC free article] [PubMed] [Google Scholar]
- Cannon TD, Sun F, McEwen SJ, Papademetris X, He G, van Erp TG, Jacobson A, Bearden CE, Walker E, Hu X et al. . 2014. Reliability of neuroanatomical measurements in a multisite longitudinal study of youth at risk for psychosis. Hum Brain Mapp. 35:2424–2434. [DOI] [PMC free article] [PubMed] [Google Scholar]
- Casey BJ, Jones RM. 2010. Neurobiology of the adolescent brain and behavior: implications for substance use disorders. J Am Acad Child Adolesc Psychiatry. 49:1189–1201; quiz 1285. [DOI] [PMC free article] [PubMed] [Google Scholar]
- Chee MW, Zheng H, Goh JO, Park D, Sutton BP. 2011. Brain structure in young and old East Asians and Westerners: comparisons of structural volume and cortical thickness. J Cogn Neurosci. 23:1065–1079. [DOI] [PMC free article] [PubMed] [Google Scholar]
- Chen CH, Fiecas M, Gutierrez ED, Panizzon MS, Eyler LT, Vuoksimaa E, Thompson WK, Fennema-Notestine C, Hagler DJ Jr, Jernigan TL et al. . 2013. Genetic topography of brain morphology. Proc Natl Acad Sci USA. 110:17089–17094. [DOI] [PMC free article] [PubMed] [Google Scholar]
- Chouinard-Decorte F, McKay DR, Reid A, Khundrakpam B, Zhao L, Karama S, Rioux P, Sprooten E, Knowles E, Kent JW Jr et al. . 2014. Heritable changes in regional cortical thickness with age. Brain Imaging Behav. 8:208–216. [DOI] [PMC free article] [PubMed] [Google Scholar]
- Chugani HT. 1998. A critical period of brain development: studies of cerebral glucose utilization with PET. Prev Med. 27:184–188. [DOI] [PubMed] [Google Scholar]
- Chugani HT, Phelps ME, Mazziotta JC. 1987. Positron emission tomography study of human brain functional development. Ann Neurol. 22:487–497. [DOI] [PubMed] [Google Scholar]
- Clarkson MJ, Ourselin S, Nielsen C, Leung KK, Barnes J, Whitwell JL, Gunter JL, Hill DL, Weiner MW, Jack CR Jr et al. . 2009. Comparison of phantom and registration scaling corrections using the ADNI cohort. Neuroimage. 47:1506–1513. [DOI] [PMC free article] [PubMed] [Google Scholar]
- Colby JB, Van Horn JD, Sowell ER. 2011. Quantitative in vivo evidence for broad regional gradients in the timing of white matter maturation during adolescence. Neuroimage. 54:25–31. [DOI] [PMC free article] [PubMed] [Google Scholar]
- Corbetta M, Shulman GL. 2002. Control of goal-directed and stimulus-driven attention in the brain. Nat Rev Neurosci. 3:201–215. [DOI] [PubMed] [Google Scholar]
- Dale AM, Fischl B, Sereno MI. 1999. Cortical surface-based analysis. I. Segmentation and surface reconstruction. Neuroimage. 9:179–194. [DOI] [PubMed] [Google Scholar]
- De Bellis MD, Narasimhan A, Thatcher DL, Keshavan MS, Soloff P, Clark DB. 2005. Prefrontal cortex, thalamus, and cerebellar volumes in adolescents and young adults with adolescent-onset alcohol use disorders and comorbid mental disorders. Alcohol Clin Exp Res. 29:1590–1600. [DOI] [PubMed] [Google Scholar]
- DeCarli C, Haxby JV, Gillette JA, Teichberg D, Rapoport SI, Schapiro MB. 1992. Longitudinal changes in lateral ventricular volume in patients with dementia of the Alzheimer type. Neurology. 42:2029–2036. [DOI] [PubMed] [Google Scholar]
- Dekaban A, Sadowsky D. 1978. Changes in brain weights during the span of human life: relation of brain weights to body heights and body weights. Ann Neurol. 4:345–356. [DOI] [PubMed] [Google Scholar]
- Desikan RS, Segonne F, Fischl B, Quinn BT, Dickerson BC, Blacker D, Buckner RL, Dale AM, Maguire RP, Hyman BT et al. . 2006. An automated labeling system for subdividing the human cerebral cortex on MRI scans into gyral based regions of interest. Neuroimage. 31:968–980. [DOI] [PubMed] [Google Scholar]
- Fan CC, Bartsch H, Schork AJ, Chen CH, Wang Y, Lo M, Brown TT, Kuperman JM, Hagler DJ Jr., Schork NJ et al. . 2015. Modeling the 3D geometry of the cortical surface with genetic ancestry. Curr Biol. 25:1–5. [DOI] [PMC free article] [PubMed] [Google Scholar]
- Feinberg I. 1974. Changes in sleep cycle patterns with age. J Psychiatr Res. 10:283–306. [DOI] [PubMed] [Google Scholar]
- Feinberg I, Thode HC, Chugani HT, March JD. 1990. Gamma distribution model describes maturational curves for delta wave amplitude, cortical metabolic rate and synaptic density. J Theor Biol. 142:149–161. [DOI] [PubMed] [Google Scholar]
- Fields RD. 2008. Oligodendrocytes changing the rules: action potentials in glia and oligodendrocytes controlling action potentials. Neuroscientist. 14:540–543. [DOI] [PMC free article] [PubMed] [Google Scholar]
- Fjell AM, Walhovd KB, Brown TT, Kuperman JM, Chung Y, Hagler DJ Jr, Venkatraman V, Roddey JC, Erhart M, McCabe C et al. . 2012. Multimodal imaging of the self-regulating developing brain. Proc Natl Acad Sci USA. 109:19620–19625. [DOI] [PMC free article] [PubMed] [Google Scholar]
- Fjell AM, Walhovd KB, Westlye LT, Ostby Y, Tamnes CK, Jernigan TL, Gamst A, Dale AM. 2010. When does brain aging accelerate? Dangers of quadratic fits in cross-sectional studies. NeuroImage. 50:1376–1383. [DOI] [PubMed] [Google Scholar]
- Giedd JN, Blumenthal J, Jeffries NO, Castellanos FX, Liu H, Zijdenbos A, Paus T, Evans AC, Rapoport JL. 1999. Brain development during childhood and adolescence: a longitudinal MRI study [letter]. Nat Neurosci. 2:861–863. [DOI] [PubMed] [Google Scholar]
- Giedd JN, Clasen LS, Lenroot R, Greenstein D, Wallace GL, Ordaz S, Molloy EA, Blumenthal JD, Tossell JW, Stayer C et al. . 2006. Puberty-related influences on brain development. Mol Cell Endocrinol. 254–255:154–162. [DOI] [PubMed] [Google Scholar]
- Giedd JN, Raznahan A, Alexander-Bloch A, Schmitt E, Gogtay N, Rapoport JL. 2014. Child psychiatry branch of the National Institute of Mental Health longitudinal structural magnetic resonance imaging study of human brain development. Neuropsychopharmacology. 40:43–49. [DOI] [PMC free article] [PubMed] [Google Scholar]
- Giedd JN, Stockman M, Weddle C, Liverpool M, Alexander-Bloch A, Wallace GL, Lee NR, Lalonde F, Lenroot RK. 2010. Anatomic magnetic resonance imaging of the developing child and adolescent brain and effects of genetic variation. Neuropsychol Rev. 20:349–361. [DOI] [PMC free article] [PubMed] [Google Scholar]
- Gogtay N, Giedd JN, Lusk L, Hayashi KM, Greenstein D, Vaituzis AC, Nugent TF III, Herman DH, Clasen LS, Toga AW et al. . 2004. Dynamic mapping of human cortical development during childhood through early adulthood. Proc Natl Acad Sci USA. 101:8174–8179. [DOI] [PMC free article] [PubMed] [Google Scholar]
- Goldstein JM, Seidman LJ, Horton NJ, Makris N, Kennedy DN, Caviness VS Jr, Faraone SV, Tsuang MT. 2001. Normal sexual dimorphism of the adult human brain assessed by in vivo magnetic resonance imaging. Cereb Cortex. 11:490–497. [DOI] [PubMed] [Google Scholar]
- Gunter JL, Bernstein MA, Borowski BJ, Ward CP, Britson PJ, Felmlee JP, Schuff N, Weiner M, Jack CR. 2009. Measurement of MRI scanner performance with the ADNI phantom. Med Phys. 36:2193–2205. [DOI] [PMC free article] [PubMed] [Google Scholar]
- Gupta SN, Belay B. 2008. Intracranial incidental findings on brain MR images in a pediatric neurology practice: a retrospective study. J Neurol Sci. 264:34–37. [DOI] [PubMed] [Google Scholar]
- Gur RE, Kaltman D, Melhem ER, Ruparel K, Prabhakaran K, Riley M, Yodh E, Hakonarson H, Satterthwaite T, Gur RC. 2013. Incidental findings in youths volunteering for brain MRI research. Am J Neuroradiol. 34:2021–2025. [DOI] [PMC free article] [PubMed] [Google Scholar]
- Hastie T, Tibshirani R. 1990. Exploring the nature of covariate effects in the proportional hazards model. Biometrics. 46:1005–1016. [PubMed] [Google Scholar]
- Hastie T, Tibshirani R. 1986. Generalized additive models (with DIscussion). Stat Sci. 1:297–318. [Google Scholar]
- Hofman MA. 2014. Evolution of the human brain: when bigger is better. Front Neuroanat. 8:15. [DOI] [PMC free article] [PubMed] [Google Scholar]
- Hogstrom LJ, Westlye LT, Walhovd KB, Fjell AM. 2013. The structure of the cerebral cortex across adult life: age-related patterns of surface area, thickness, and gyrification. Cereb Cortex. 23:2521–2530. [DOI] [PubMed] [Google Scholar]
- Huttenlocher PR. 1979. Synaptic density in human frontal cortex: developmental changes and effects of aging. Brain Res. 163:195–205. [DOI] [PubMed] [Google Scholar]
- Iglesias JE, Liu CY, Thompson PM, Tu Z. 2011. Robust brain extraction across datasets and comparison with publicly available methods. IEEE Trans Med Imaging. 30:1617–1634. [DOI] [PubMed] [Google Scholar]
- Illes J, Kirschen MP, Edwards E, Stanford LR, Bandettini P, Cho MK, Ford PJ, Glover GH, Kulynych J, Macklin R et al. . 2006. Ethics. Incidental findings in brain imaging research. Science. 311:783–784. [DOI] [PMC free article] [PubMed] [Google Scholar]
- Illes J, Kirschen MP, Karetsky K, Kelly M, Saha A, Desmond JE, Raffin TA, Glover GH, Atlas SW. 2004. Discovery and disclosure of incidental findings in neuroimaging research. J Magn Reson Imaging. 20:743–747. [DOI] [PMC free article] [PubMed] [Google Scholar]
- Im K, Lee JM, Lyttelton O, Kim SH, Evans AC, Kim SI. 2008. Brain size and cortical structure in the adult human brain. Cereb Cortex. 18:2181–2191. [DOI] [PubMed] [Google Scholar]
- Jernigan TL, Brown TT, Hagler DJ Jr, Akshoomoff N, Bartsch H, Newman E, Thompson WK, Bloss CS, Murray SS, Schork N et al. . 2015. The Pediatric Imaging, Neurocognition, and Genetics (PING) Data Repository. Neuroimage. doi:10.1016/neuroimage.2015.04.057. [Epub ahead of print]. [DOI] [PMC free article] [PubMed] [Google Scholar]
- Jernigan TL, Trauner DA, Hesselink JR, Tallal PA. 1991. Maturation of human cerebrum observed in vivo during adolescence. Brain. 114:2037–2049. [DOI] [PubMed] [Google Scholar]
- Kim BS, Illes J, Kaplan RT, Reiss A, Atlas SW. 2002. Incidental findings on pediatric MR images of the brain. Am J Neuroradiol. 23:1674–1677. [PMC free article] [PubMed] [Google Scholar]
- Lawson GM, Duda JT, Avants BB, Wu J, Farah MJ. 2013. Associations between children's socioeconomic status and prefrontal cortical thickness. Dev Sci. 16:641–652. [DOI] [PMC free article] [PubMed] [Google Scholar]
- Lee TO, Hwang HS, De Salles A, Mattozo C, Pedroso AG, Behnke E. 2008. Inter-racial, gender and aging influences in the length of anterior commissure-posterior commissure line. J Korean Neurosurg Soc. 43:79–84. [DOI] [PMC free article] [PubMed] [Google Scholar]
- Lenroot RK, Gogtay N, Greenstein DK, Wells EM, Wallace GL, Clasen LS, Blumenthal JD, Lerch J, Zijdenbos AP, Evans AC et al. . 2007. Sexual dimorphism of brain developmental trajectories during childhood and adolescence. Neuroimage. 36:1065–1073. [DOI] [PMC free article] [PubMed] [Google Scholar]
- Lerch JP, Worsley K, Shaw WP, Greenstein DK, Lenroot RK, Giedd J, Evans AC. 2006. Mapping anatomical correlations across cerebral cortex (MACACC) using cortical thickness from MRI. Neuroimage. 31:993–1003. [DOI] [PubMed] [Google Scholar]
- Luna B, Thulborn KR, Munoz DP, Merriam EP, Garver KE, Minshew NJ, Keshavan MS, Genovese CR, Eddy WF, Sweeney JA. 2001. Maturation of widely distributed brain function subserves cognitive development. Neuroimage. 13:786–793. [DOI] [PubMed] [Google Scholar]
- Luo Y, Shi L, Weng J, He H, Chu WC, Chen F, Wang D. 2014. Intensity and sulci landmark combined brain atlas construction for Chinese pediatric population. Hum Brain Mapp. 35:3880–3892. [DOI] [PMC free article] [PubMed] [Google Scholar]
- Madsen SK, Gutman BA, Joshi SH, Toga AW, Jack CR Jr, Weiner MW, Thompson PM. 2015. Mapping ventricular expansion onto cortical gray matter in older adults. Neurobiol Aging. 36(Suppl. 1):S32–S41. [DOI] [PMC free article] [PubMed] [Google Scholar]
- McKay DR, Knowles EE, Winkler AA, Sprooten E, Kochunov P, Olvera RL, Curran JE, Kent JW Jr, Carless MA, Goring HH et al. . 2014. Influence of age, sex and genetic factors on the human brain. Brain Imaging Behav. 8:143–152. [DOI] [PMC free article] [PubMed] [Google Scholar]
- Morris Z, Whiteley WN, Longstreth WT Jr, Weber F, Lee YC, Tsushima Y, Alphs H, Ladd SC, Warlow C, Wardlaw JM et al. . 2009. Incidental findings on brain magnetic resonance imaging: systematic review and meta-analysis. BMJ. 339:b3016. [DOI] [PMC free article] [PubMed] [Google Scholar]
- Nestor SM, Rupsingh R, Borrie M, Smith M, Accomazzi V, Wells JL, Fogarty J, Bartha R. 2008. Ventricular enlargement as a possible measure of Alzheimer's disease progression validated using the Alzheimer's disease neuroimaging initiative database. Brain. 131:2443–2454. [DOI] [PMC free article] [PubMed] [Google Scholar]
- Nichols BN, Pohl KM. 2015. Neuroinformatics software applications supporting electronic data capture, management, and sharing for the neuroimaging community. Neuropsychology Rev. 25 [Epub ahead of print 2015 Aug 13]. [DOI] [PMC free article] [PubMed] [Google Scholar]
- Noble KG, Houston SM, Brito NH, Bartsch H, Kan E, Kuperman JM, Akshoomoff N, Amaral DG, Bloss CS, Libiger O et al. . 2015. Family income, parental education and brain structure in children and adolescents. Nat Neurosci. 18:773–778. [DOI] [PMC free article] [PubMed] [Google Scholar]
- Noble KG, Houston SM, Kan E, Sowell ER. 2012. Neural correlates of socioeconomic status in the developing human brain. Dev Sci. 15:516–527. [DOI] [PMC free article] [PubMed] [Google Scholar]
- Padilla ML, Pfefferbaum A, Sullivan EV, Baker FC, Colrain IM. 2014. Dissociation of preparatory attention and response monitoring maturation during adolescence. Clin Neurophysiol. 125:962–970. [DOI] [PMC free article] [PubMed] [Google Scholar]
- Panizzon MS, Fennema-Notestine C, Eyler LT, Jernigan TL, Prom-Wormley E, Neale M, Jacobson K, Lyons MJ, Grant MD, Franz CE et al. . 2009. Distinct genetic influences on cortical surface area and cortical thickness. Cereb Cortex. 19:2728–2735. [DOI] [PMC free article] [PubMed] [Google Scholar]
- Paus T. 2010. Sex differences in the human brain: a developmental perspective. Prog Brain Res. 186:13–28. [DOI] [PubMed] [Google Scholar]
- Paus T, Collins DL, Evans AC, Leonard G, Pike B, Zijdenbos A. 2001. Maturation of white matter in the human brain: a review of magnetic resonance studies. Brain Res Bull. 54:255–266. [DOI] [PubMed] [Google Scholar]
- Pfefferbaum A, Mathalon DH, Sullivan EV, Rawles JM, Zipursky RB, Lim KO. 1994. A quantitative magnetic resonance imaging study of changes in brain morphology from infancy to late adulthood. Arch Neurol. 51:874–887. [DOI] [PubMed] [Google Scholar]
- Pfefferbaum A, Rohlfing T, Rosenbloom MJ, Chu W, Colrain IM, Sullivan EV. 2013. Variation in longitudinal trajectories of regional brain volumes of healthy men and women (ages 10 to 85 years) measured with atlas-based parcellation of MRI. Neuroimage. 65:176–193. [DOI] [PMC free article] [PubMed] [Google Scholar]
- Pitel AL, Chanraud S, Sullivan EV, Pfefferbaum A. 2010. Callosal microstructural abnormalities in Alzheimer's disease and alcoholism: same phenotype, different mechanisms. Psychiatry Res. 184:45–96. [DOI] [PMC free article] [PubMed] [Google Scholar]
- Posner MI, Petersen SE. 1990. The attention system of the human brain. Annu Rev Neurosci. 13:25–42. [DOI] [PubMed] [Google Scholar]
- Rakic P. 1995. A small step for the cell, a giant leap for mankind: a hypothesis of neocortical expansion during evolution. Trends Neurosci. 18:383–388. [DOI] [PubMed] [Google Scholar]
- Rakic P. 2009. Evolution of the neocortex: a perspective from developmental biology. Nat Rev Neurosci. 10:724–735. [DOI] [PMC free article] [PubMed] [Google Scholar]
- Raz N, Ghisletta P, Rodrigue KM, Kennedy KM, Lindenberger U. 2010. Trajectories of brain aging in middle-aged and older adults: regional and individual differences. Neuroimage. 51:501–511. [DOI] [PMC free article] [PubMed] [Google Scholar]
- Raznahan A, Greenstein D, Lee NR, Clasen LS, Giedd JN. 2012. Prenatal growth in humans and postnatal brain maturation into late adolescence. Proc Natl Acad Sci USA. 109:11366–11371. [DOI] [PMC free article] [PubMed] [Google Scholar]
- Raznahan A, Lee Y, Stidd R, Long R, Greenstein D, Clasen L, Addington A, Gogtay N, Rapoport JL, Giedd JN. 2010. Longitudinally mapping the influence of sex and androgen signaling on the dynamics of human cortical maturation in adolescence. Proc Natl Acad Sci USA. 107:16988–16993. [DOI] [PMC free article] [PubMed] [Google Scholar]
- Raznahan A, Lerch JP, Lee N, Greenstein D, Wallace GL, Stockman M, Clasen L, Shaw PW, Giedd JN. 2011. Patterns of coordinated anatomical change in human cortical development: a longitudinal neuroimaging study of maturational coupling. Neuron. 72:873–884. [DOI] [PMC free article] [PubMed] [Google Scholar]
- Reneman L, de Win MM, Booij J, van den Brink W, den Heeten GJ, Freling N, Majoie CB. 2012. Incidental head and neck findings on MRI in young healthy volunteers: prevalence and clinical implications. Am J Neuroradiol. 33:1971–1974. [DOI] [PMC free article] [PubMed] [Google Scholar]
- Rohlfing T, Cummins K, Henthorn T, Chu W, Nichols BN. 2014. N-CANDA data integration: anatomy of an asynchronous infrastructure for multi-site, multi-instrument longitudinal data capture. J Am Med Inform Assoc. 21:758–762. [DOI] [PMC free article] [PubMed] [Google Scholar]
- Rohlfing T, Russakoff DB, Maurer CR Jr. 2004. Performance-based classifier combination in atlas-based image segmentation using Expectation-Maximization Parameter Estimation. IEEE Trans Med Imaging. 23:983–994. [DOI] [PubMed] [Google Scholar]
- Rohlfing T, Zahr NM, Sullivan EV, Pfefferbaum A. 2010. The SRI24 multi-channel atlas of normal adult human brain structure. Hum Brain Mapp. 31:798–819. [DOI] [PMC free article] [PubMed] [Google Scholar]
- Schmitt JE, Neale MC, Fassassi B, Perez J, Lenroot RK, Wells EM, Giedd JN. 2014. The dynamic role of genetics on cortical patterning during childhood and adolescence. Proc Natl Acad Sci USA. 111:6774–6779. [DOI] [PMC free article] [PubMed] [Google Scholar]
- Shaw P, Kabani NJ, Lerch JP, Eckstrand K, Lenroot R, Gogtay N, Greenstein D, Clasen L, Evans A, Rapoport JL et al. . 2008. Neurodevelopmental trajectories of the human cerebral cortex. J Neurosci. 28:3586–3594. [DOI] [PMC free article] [PubMed] [Google Scholar]
- Shirtcliff EA, Dahl RE, Pollak SD. 2009. Pubertal development: correspondence between hormonal and physical development. Child Dev. 80:327–337. [DOI] [PMC free article] [PubMed] [Google Scholar]
- Smith S. 2002. Fast robust automated brain extraction. Hum Brain Mapp. 17:143–155. [DOI] [PMC free article] [PubMed] [Google Scholar]
- Sowell ER, Peterson BS, Kan E, Woods RP, Yoshii J, Bansal R, Xu D, Zhu H, Thompson PM, Toga AW. 2007. Sex differences in cortical thickness mapped in 176 healthy individuals between 7 and 87 years of age. Cereb Cortex. 17:1550–1560. [DOI] [PMC free article] [PubMed] [Google Scholar]
- Sowell ER, Thompson PM, Leonard CM, Welcome SE, Kan E, Toga AW. 2004. Longitudinal mapping of cortical thickness and brain growth in normal children. J Neurosci. 24:8223–8231. [DOI] [PMC free article] [PubMed] [Google Scholar]
- Sowell ER, Thompson PM, Toga AW. 2004. Mapping changes in the human cortex throughout the span of life. Neuroscientist. 10:372–392. [DOI] [PubMed] [Google Scholar]
- Spronk M, Vogel EK, Jonkman LM. 2012. Electrophysiological evidence for immature processing capacity and filtering in visuospatial working memory in adolescents. PLoS One. 7:e42262. [DOI] [PMC free article] [PubMed] [Google Scholar]
- Squeglia LM, Jacobus J, Tapert SF. 2014. The effect of alcohol use on human adolescent brain structures and systems. Handb Clin Neurol. 125:501–510. [DOI] [PMC free article] [PubMed] [Google Scholar]
- Squeglia LM, Tapert SF, Sullivan EV, Jacobus J, Meloy MJ, Rohlfing T, Pfefferbaum A. 2015. Brain development in heavy drinking adolescents. Am J Psychiatry. 172:531–542. [DOI] [PMC free article] [PubMed] [Google Scholar]
- Stiles J, Jernigan TL. 2010. The basics of brain development. Neuropsychol Rev. 20:327–348. [DOI] [PMC free article] [PubMed] [Google Scholar]
- Storsve AB, Fjell AM, Tamnes CK, Westlye LT, Overbye K, Aasland HW, Walhovd KB. 2014. Differential longitudinal changes in cortical thickness, surface area and volume across the adult life span: regions of accelerating and decelerating change. J Neurosci. 34:8488–8498. [DOI] [PMC free article] [PubMed] [Google Scholar]
- Sullivan EV, Pfefferbaum A, Rohlfing T, Baker FC, Padilla ML, Colrain IM. 2011. Developmental change in regional brain structure over 7 months in early adolescence: comparison of approaches for longitudinal atlas-based parcellation. Neuroimage. 57:214–224. [DOI] [PMC free article] [PubMed] [Google Scholar]
- Swendsen J, Burstein M, Case B, Conway KP, Dierker L, He J, Merikangas KR. 2012. Use and abuse of alcohol and illicit drugs in US adolescents: results of the National Comorbidity Survey-Adolescent Supplement. Arch Gen Psychiatry. 69:390–398. [DOI] [PMC free article] [PubMed] [Google Scholar]
- Tang Y, Hojatkashani C, Dinov ID, Sun B, Fan L, Lin X, Qi H, Hua X, Liu S, Toga AW. 2010. The construction of a Chinese MRI brain atlas: a morphometric comparison study between Chinese and Caucasian cohorts. Neuroimage. 51:33–41. [DOI] [PMC free article] [PubMed] [Google Scholar]
- Tobias PV. 1970. Brain-size, grey matter and race--fact or fiction. Am J Phys Anthropol. 32:3–25. [DOI] [PubMed] [Google Scholar]
- Toga AW, Thompson PM, Sowell ER. 2006. Mapping brain maturation. Trends Neurosci. 29:148–159. [DOI] [PMC free article] [PubMed] [Google Scholar]
- Uchiyama HT, Seki A, Tanaka D, Koeda T, Jcs G. 2013. A study of the standard brain in Japanese children: morphological comparison with the MNI template. Brain Dev. 35:228–235. [DOI] [PubMed] [Google Scholar]
- Vetreno RP, Crews FT. 2014. Current hypotheses on the mechanisms of alcoholism. Handb Clin Neurol. 125:477–497. [DOI] [PMC free article] [PubMed] [Google Scholar]
- Walhovd KB, Fjell AM, Brown TT, Kuperman JM, Chung Y, Hagler DJ Jr, Roddey JC, Erhart M, McCabe C, Akshoomoff N et al. . 2012. Long-term influence of normal variation in neonatal characteristics on human brain development. Proc Natl Acad Sci USA. 109:20089–20094. [DOI] [PMC free article] [PubMed] [Google Scholar]
- Whelan R, Watts R, Orr CA, Althoff RR, Artiges E, Banaschewski T, Barker GJ, Bokde AL, Buchel C, Carvalho FM et al. . 2014. Neuropsychosocial profiles of current and future adolescent alcohol misusers. Nature. 512:185–189. [DOI] [PMC free article] [PubMed] [Google Scholar]
- Whitehead MT, Oh CC, Choudhri AF. 2013. Incidental pineal cysts in children who undergo 3-T MRI. Pediatr Radiol. 43:1577–1583. [DOI] [PubMed] [Google Scholar]
- Wierenga LM, Langen M, Oranje B, Durston S. 2014. Unique developmental trajectories of cortical thickness and surface area. Neuroimage. 87:120–126. [DOI] [PubMed] [Google Scholar]
- Wood SN. 2011. Fast stable restricted maximum likelihood and marginal likelihood estimation of semiparametric generalized linear modelsFast stable restricted maximum likelihood and marginal likelihood estimation of semiparametric generalized linear models. J R Stat Soc B. 73:3–36. [Google Scholar]
- Wood SN. 2006. Low-rank scale-invariant tensor product smooths for generalized additive mixed models. Biometrics. 62:1025–1036. [DOI] [PubMed] [Google Scholar]
- Yakovlev PI, Lecours A-R. 1967. The myelogenetic cycles of regional maturation of the brain. In: Minkowski A, editor. Regional development of the brain in early life. Oxford: Blackwell Scientific Publications; p. 3–70. [Google Scholar]
- Zatorre RJ, Fields RD, Johansen-Berg H. 2012. Plasticity in gray and white: neuroimaging changes in brain structure during learning. Nat Neurosci. 15:528–536. [DOI] [PMC free article] [PubMed] [Google Scholar]
Associated Data
This section collects any data citations, data availability statements, or supplementary materials included in this article.


