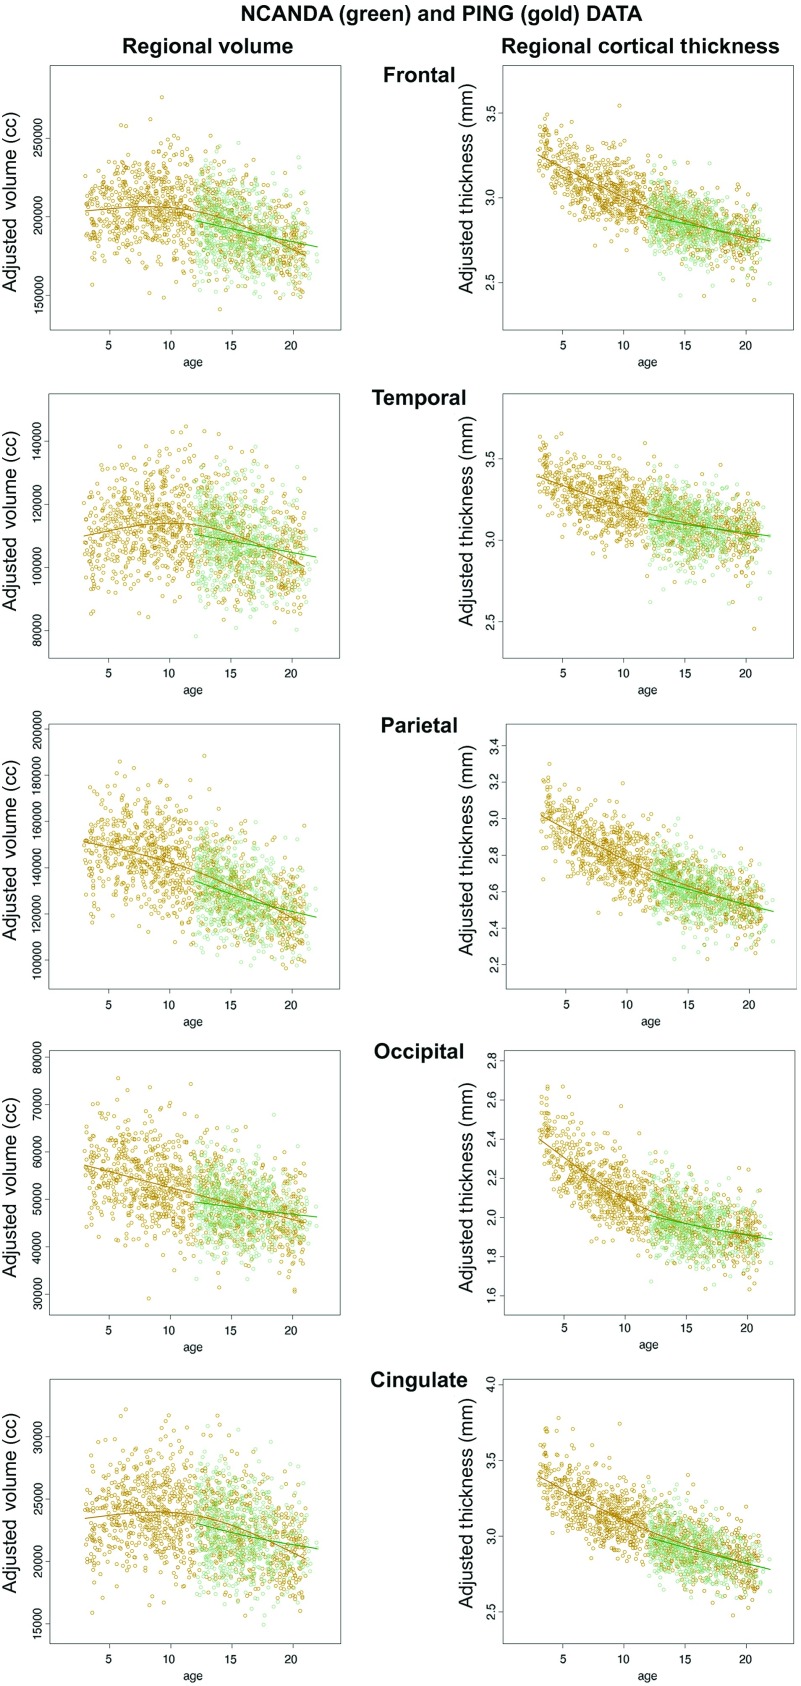
Figure 12.
Scatterplots of regional cortical volumes and thickness (adjusted for manufacturer, ethnicity, SES, and sex) and regression lines of the PING sample (gold) and the NCANDA sample (green). The PING data were better fit with nonlinear functions, whereas the NCANDA data were better fit with linear functions. In both samples, older participants had smaller volumes and thinner cortices than younger participants.

