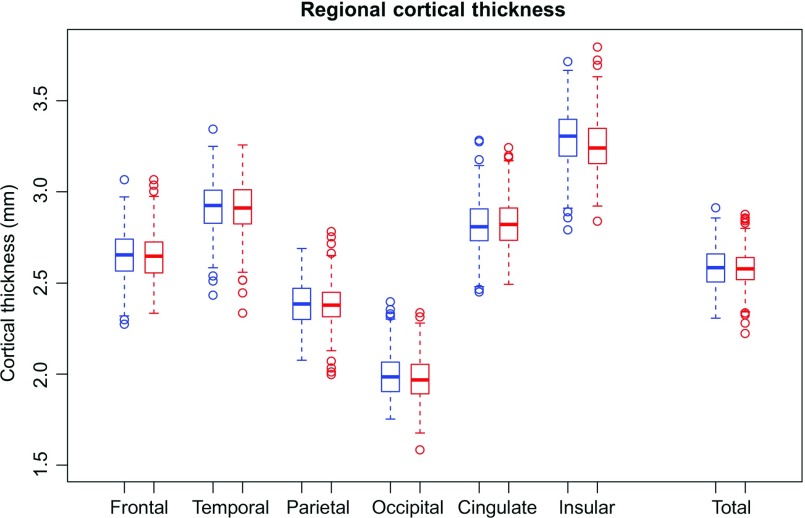
Figure 7.
Box plots: Thickness of the 6 cortical regions and the total cortex (male = blue; female = red). The measures are adjusted for manufacturer, ethnicity, and SES but not supratentorial volume (svol) and show the absence of sex differences in regional cortical thickness even without adjustment for svol.

