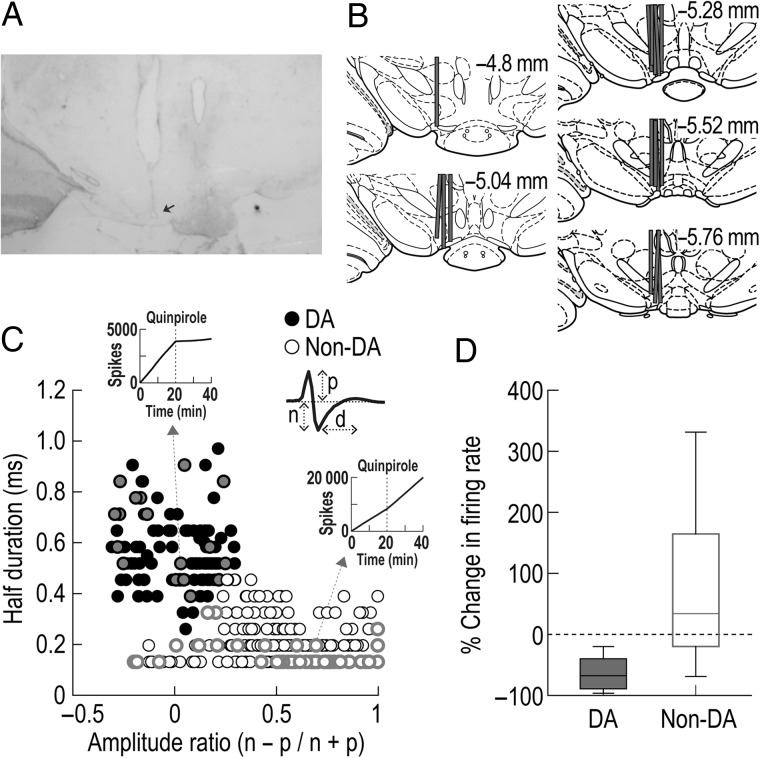
Figure 2.
Histological verification of recording sites and classification of putative DA cells in the VTA. (A) A Nissl-stained section showing the final location of a tetrode tip in the VTA. The arrow shows an electrolytic lesion made after the final recording session. (B) Reconstruction of all tetrode tracks. (C) Cluster analysis for all VTA neurons. Putative DA cells in black were identified using 2 waveform features: half spike duration (d) and the amplitude ratio of the first positive peak (p) and negative valley (n). Inset cumulative sum plots depict the effects of quinpirole on spontaneous firing of a putative DA and a putative non-DA cell. (D) Box plots showing changes in spontaneous firing after quinpirole injections. VTA neurons in gray (C) were tested with quinpirole, a D2 receptor agonist, after daily behavioral recording.

