Figure 4.
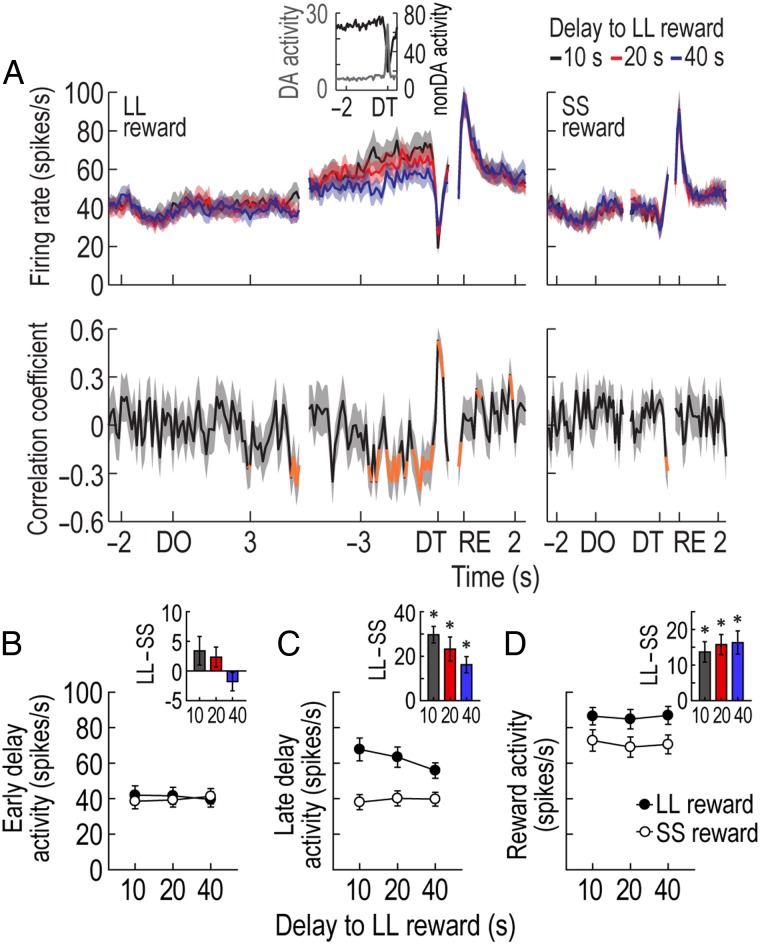
Activity of putative non-DA cells in the delay discounting task. (A) Population histograms (bin width, 100 ms) of reward-responsive non-DA cells and correlation coefficients over the course of delays. Data are aligned to DO, DT, and reward (RE). Significant correlation coefficients for >2 consecutive bins were depicted in orange. The inset graph (bin width, 50 ms) shows that when reward-responsive non-DA cells were abruptly inhibited to a low firing rate at the end of the 10-s delay to LL reward, putative DA cells reached the peak of their phasic responses. (B,C) Average responses during an early phase (1.5 s after DO) and a late phase (1.5 s before DT) of all delays. Inset bar graphs indicate differential firing between LL and SS reward conditions within blocks of trials (t-test, *P < 0.001). (D) Average reward activity. Shaded areas and error bars show SEM.

