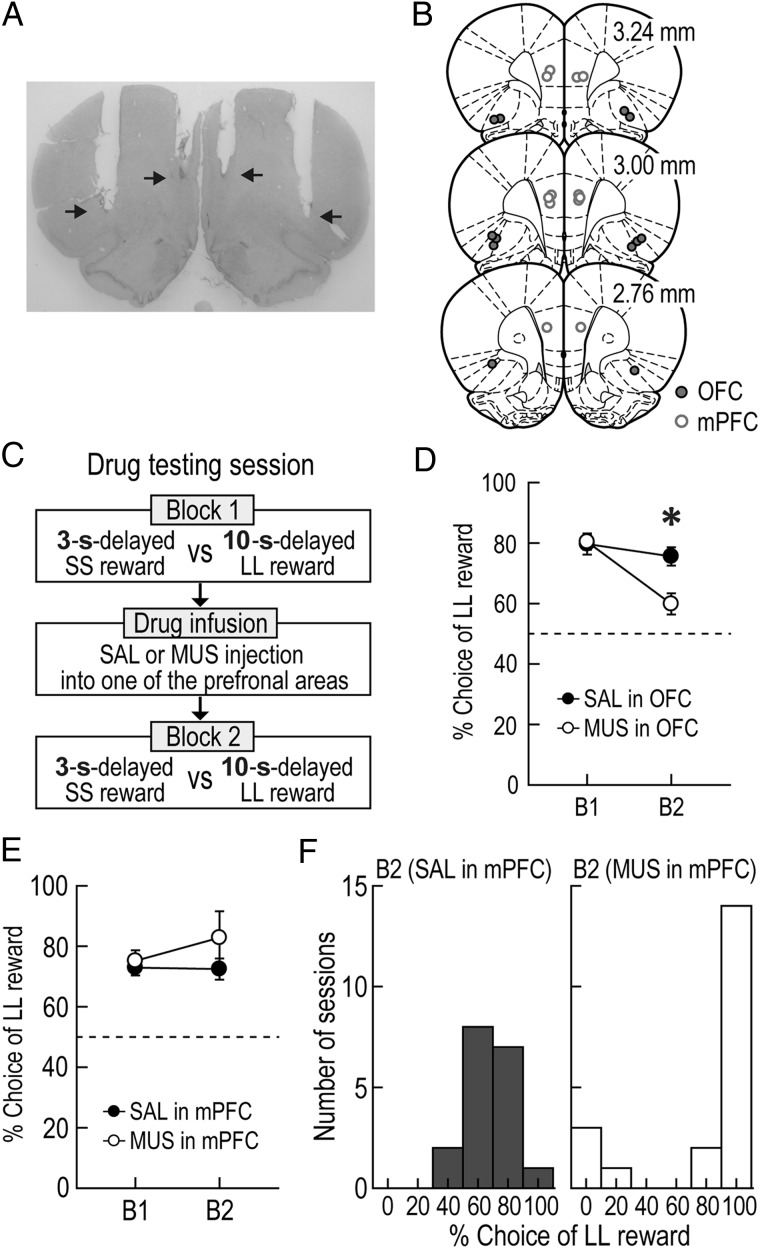
Figure 5.
Effects of prefrontal inactivation on choice performance. (A) A Nissl-stained photomicrograph for cannula placement in the OFC and the mPFC. The arrows indicate the tips of injection cannula. (B) Illustration of all microinjection sites. (C) Drug testing procedures. The goal arms associated 3-s-delayed SS and 10-s-delayed LL rewards were randomly selected on each testing day. After the first block of trials (B1) was tested without any drugs, either SAL or MUS was infused into one of the PFC subregions prior to the second blocks (B2). (D,E) Changes in choice preference for LL reward after OFC (D) and mPFC (E) inactivation (*P < 0.01). (F) Distributions of behavioral performance tested after injecting drugs into the mPFC. Error bars represent SEM.

