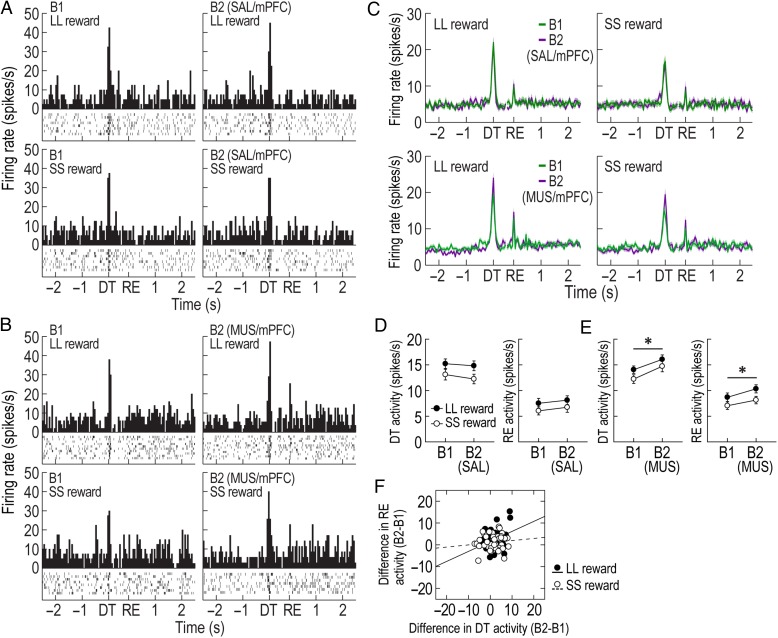
Figure 7.
Effects of mPFC inactivation on putative DA cells. (A,B) Examples of representative putative DA cells recorded with SAL (A) and MUS (B) injections. Histograms (bin width, 50 ms) are aligned to DT and reward (RE). (C) Population responses of all task-related DA cells. (D,E) Average DT and reward responses in the first (B1) and second blocks (B2) of SAL/mPFC (D) and MUS/mPFC (E) sessions (*P < 0.01). (F) Correlations between altered DT and reward responses across blocks in MUS/mPFC sessions. Shaded areas and error bars show SEM.

