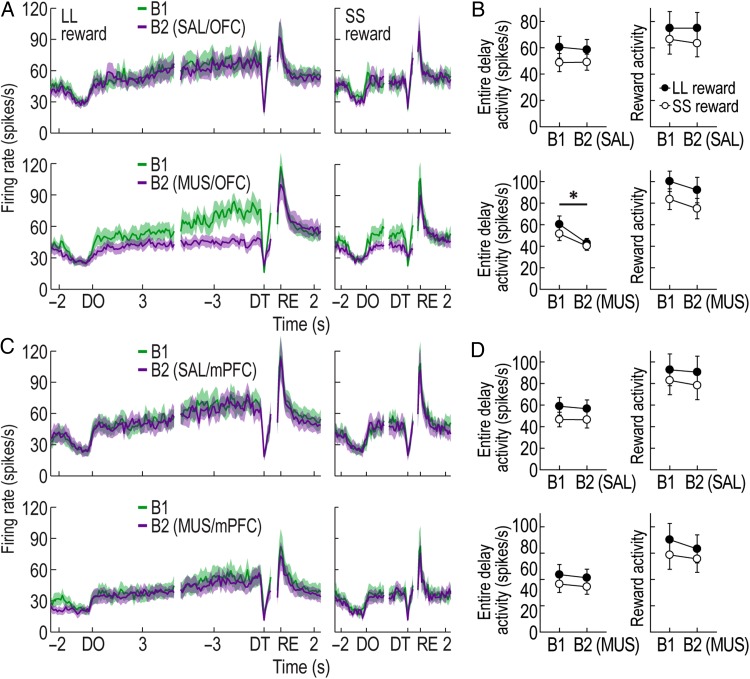
Figure 8.
Effects of prefrontal inactivation on putative non-DA cells. (A) Population histograms (bin width, 100 ms) of all reward-responsive non-DA cells recorded with OFC manipulations. Data are aligned to DO, DT, and reward (RE). (B) Average activity during the entire delays and reward activity in the first (B1) and second blocks (B2) of SAL/OFC and MUS/OFC sessions (*P < 0.01). (C) Population activity of all reward-responsive non-DA cells recorded with mPFC manipulations. (D) Average activity during the entire delays and reward activity with SAL or MUS injections into the mPFC. All graphs represent mean ± SEM.

