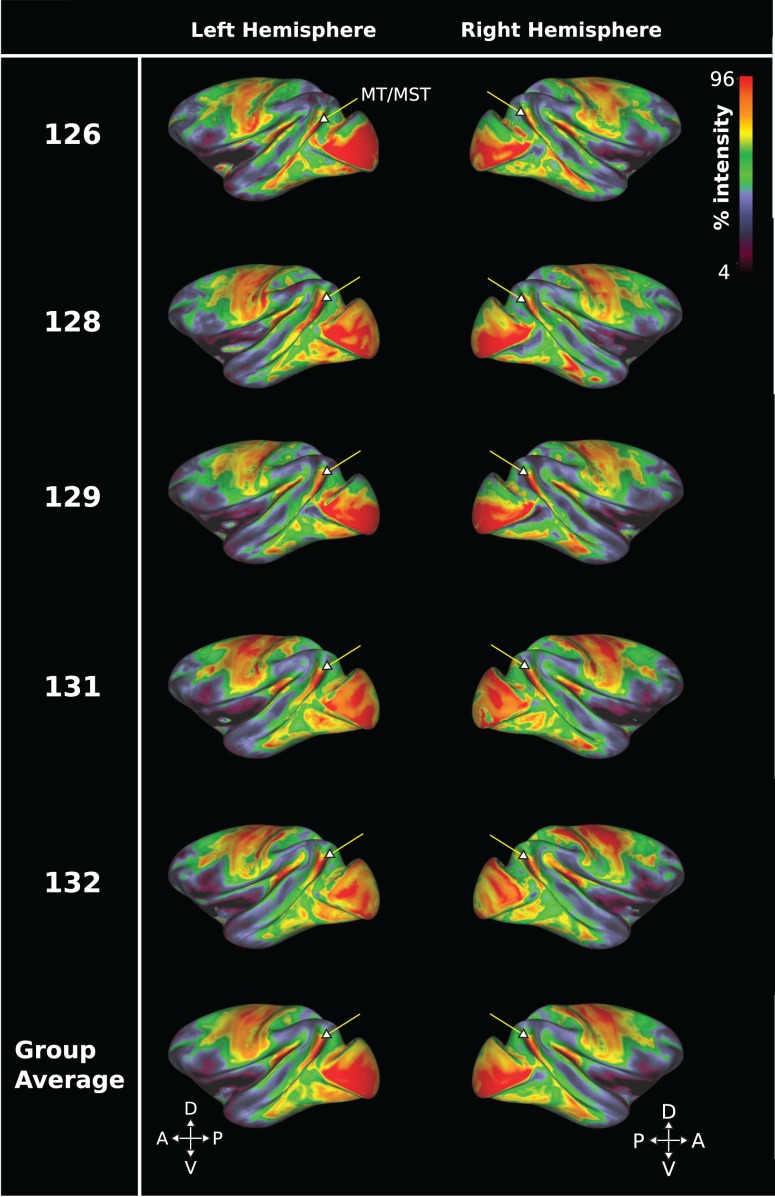
Figure 2.
Cortical surface myelin maps from in vivo 3T T1w/T2w sMRI data for 5 Rhesus macaques. Data are presented on a color map scale, with red indicating high sMRI signal intensity and therefore regions of greater myelin density. An arrow indicates the approximate anatomical position of V5/MT and MST. Each row displays the left and right hemisphere from a different subject, with the bottom row showing average data. The data show that a high myelin signal delineates a distinct region coinciding with the anatomical location of area V5/MT and MST in the dorsal STS of the Rhesus macaque.

