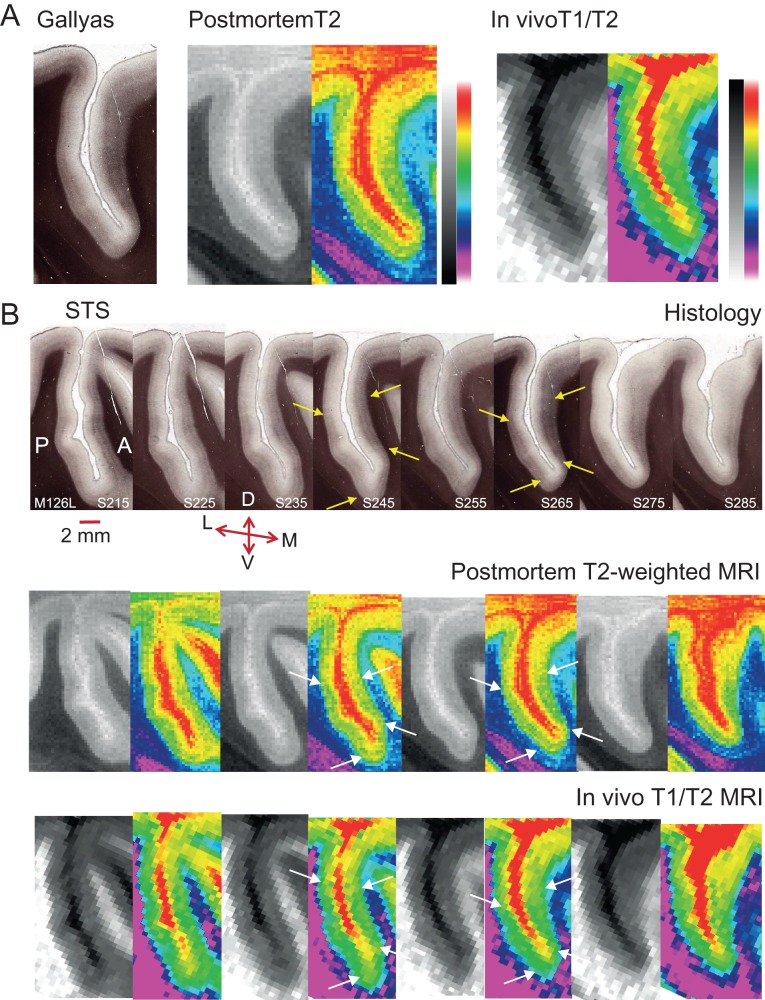
Figure 3.
Slice-by-slice comparison of histological sections and matched sMRI for the Rhesus macaque. (A) A Gallyas-stained parasagittal section showing the dorsal part of the STS from the left hemisphere of 1 macaque (M126L, S265) was matched to the equivalent parasagittal sections obtained previously from a postmortem scan of the same intact, fixed brain and to MRI obtained from the same brain in vivo. The histological section is 50 μm thick: dense cortical myelin shows up as dark brown, particularly in the lower cortical layers in the histological sections. In the postmortem T2w MRI scans, this is evident in dark regions relative to surrounding cortical tissue, and as lighter voxels relative to surrounding cortical tissue for the in vivo T1w/T2w images. To enhance visibility, the same sMRI images were pseudo-colored by converting to a color gradient (Adobe Photoshop; gradient map “transparent rainbow”; postmortem images were contrast inverted to yield the same color scale). (B) Shown is a 1 in 10 series of 50 μm parasagittal sections with a separation of 500 μm between consecutive histological sections for the same hemisphere (M126L) as in (A). The series was matched to the equivalent sMRI slices obtained postmortem or in vivo from the same block of cortical tissue. Yellow/white arrows indicate borders of dense myelination for extrastriate visual area V5/MT on the posterior bank of the STS, and for parts of MST on the anterior bank across all 3 methods for 2 example sections. Every second MRI section was replaced with a pseudo-colored version (see A.). The original MRI sections from M126L and from a further example brain are available online as Supplementary Figure S1. Series orientation: lateral (L) to medial (M). Section orientation: D, dorsal; V, ventral; P, posterior; A, anterior.

