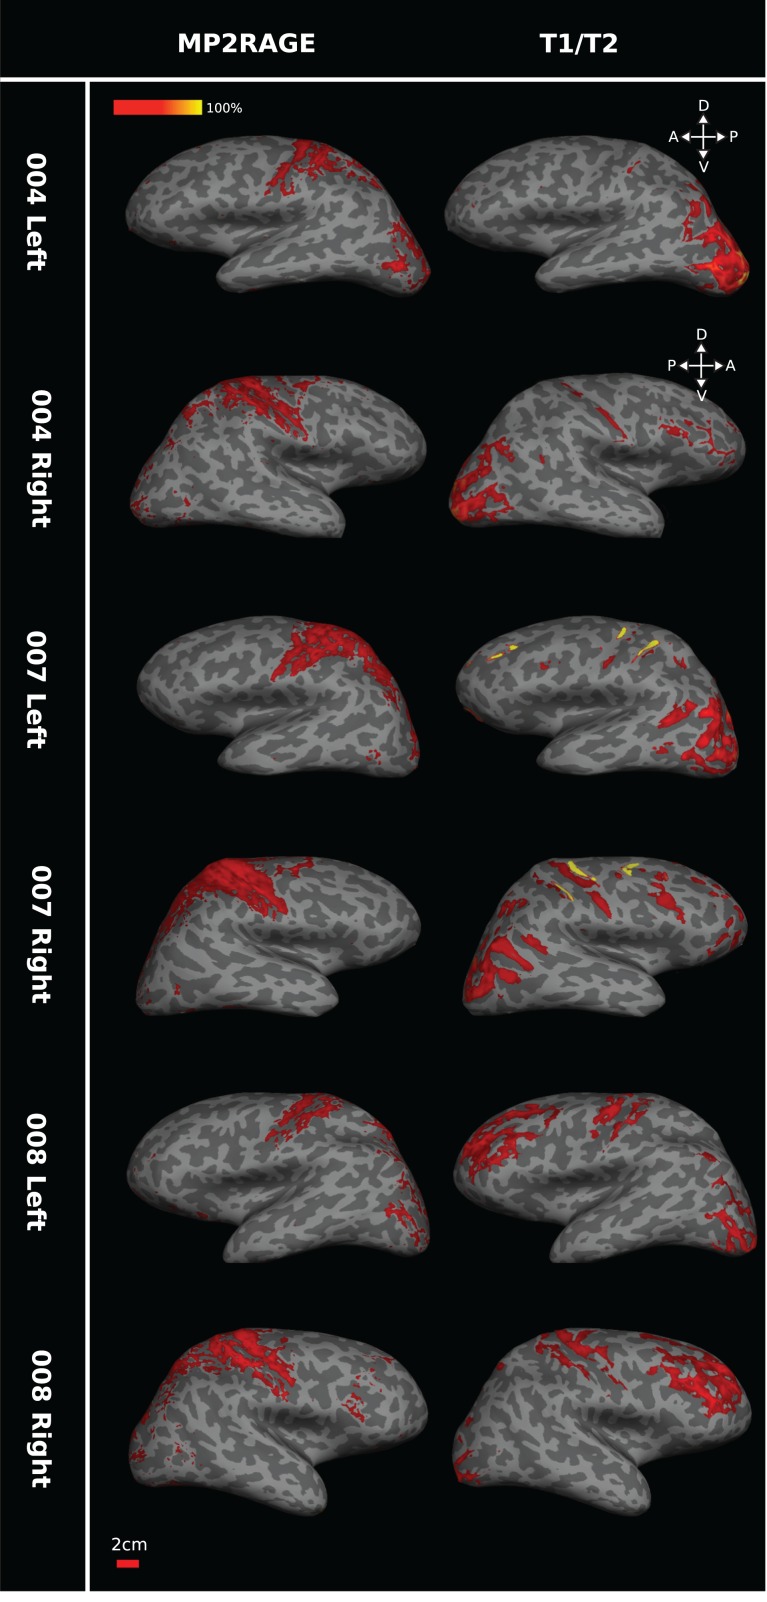
Figure 6.
Comparing 7T MP2RAGE and 3T T1w/T2w scans for myelin in humans. The pair of images in each row shows the myelin maps obtained for one hemisphere of the same individual participant based on the MP2RAGE images at 7T (left) or on T1w/T2w at 3T (right). While 7T MP2RAGE appears more sensitive to central sulcus myelin and 3T T1w/T2w images to occipital myelin and despite some individual variation, the general pattern in these images indicates consistency of high sMRI signal in regions associated with dense myelination (central sulcus, V1, hMT+). Data for each of the 3 participants (004, 007, and 008) are presented on each individual's inflated surface generated from 7T structural scans. Brain orientation: D, dorsal; V, ventral; A, anterior; P, posterior.

