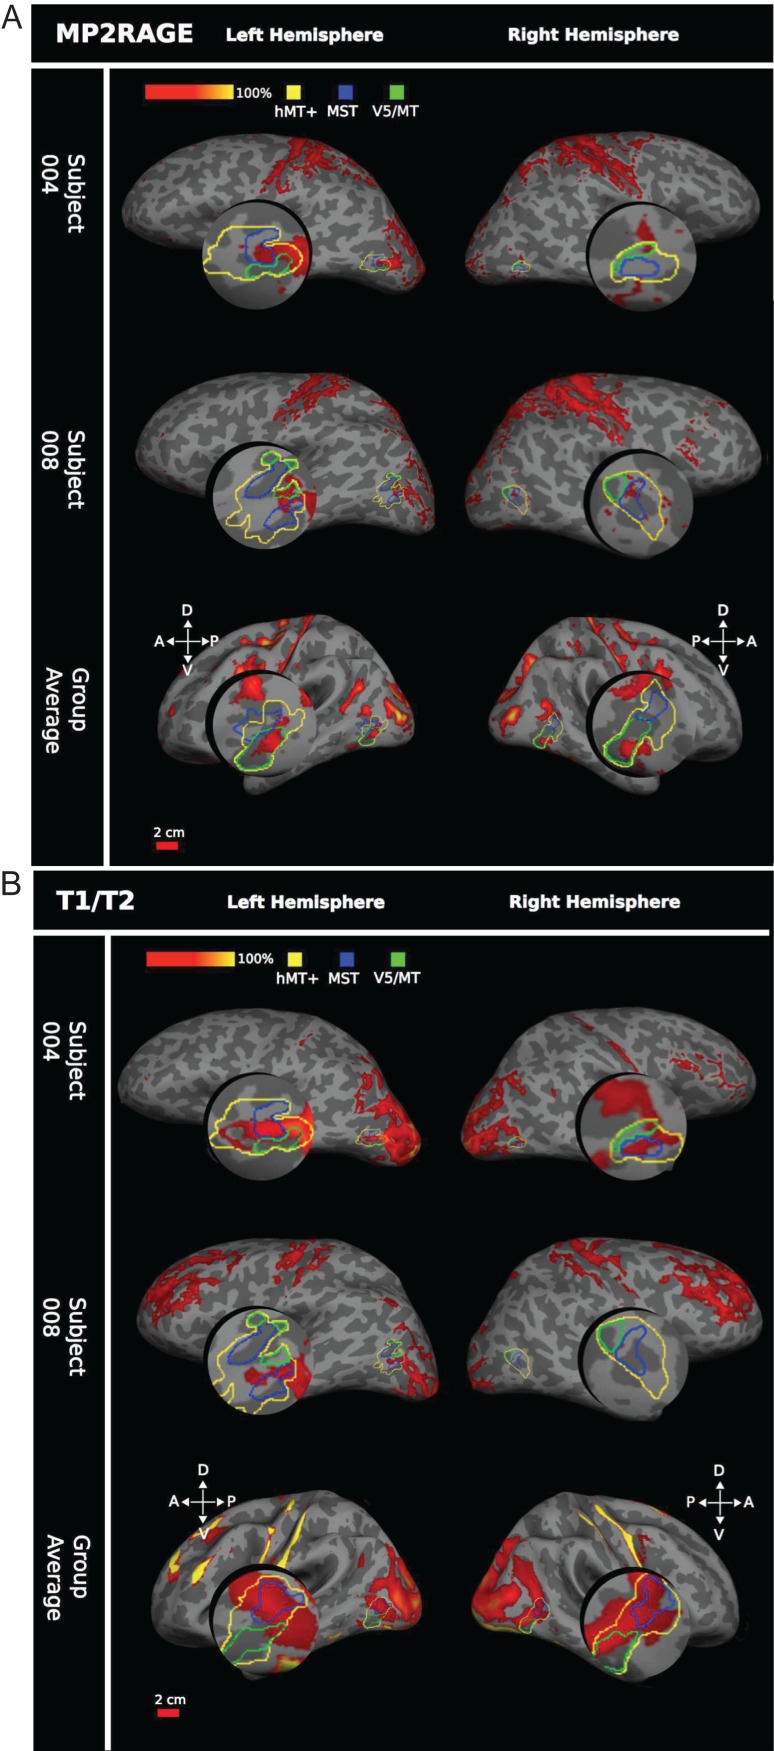
Figure 7.
Comparing myelin intensity with functional hMT+ in humans. (A) 7T MP2RAGE myelin, 2 example participants and group average (n = 10 participants). Functional hMT+ is outlined in yellow, functional MST in blue, and retinotopically defined V5/MT in green. Myelin dense areas were calculated as +1 SEM above the mean intensity of the 7T MP2RAGE image, shown on a red-yellow scale of intensity values. In all hemispheres, a region of dense myelination is associated with area hMT+, MST, or V5/MT. However, there is no consistent association across individuals. All data are presented on the individual subject's inflated cortical surface generated from a 7T structural scan, or the average generated surface (for the average data). (B) Human 3T T1w/T2w myelin shows 2 example subjects plus group average (n = 3 participants). Similar measurements and same conventions as in (A), but here the myelin maps were generated from the 3T T1w/T2w scan.

