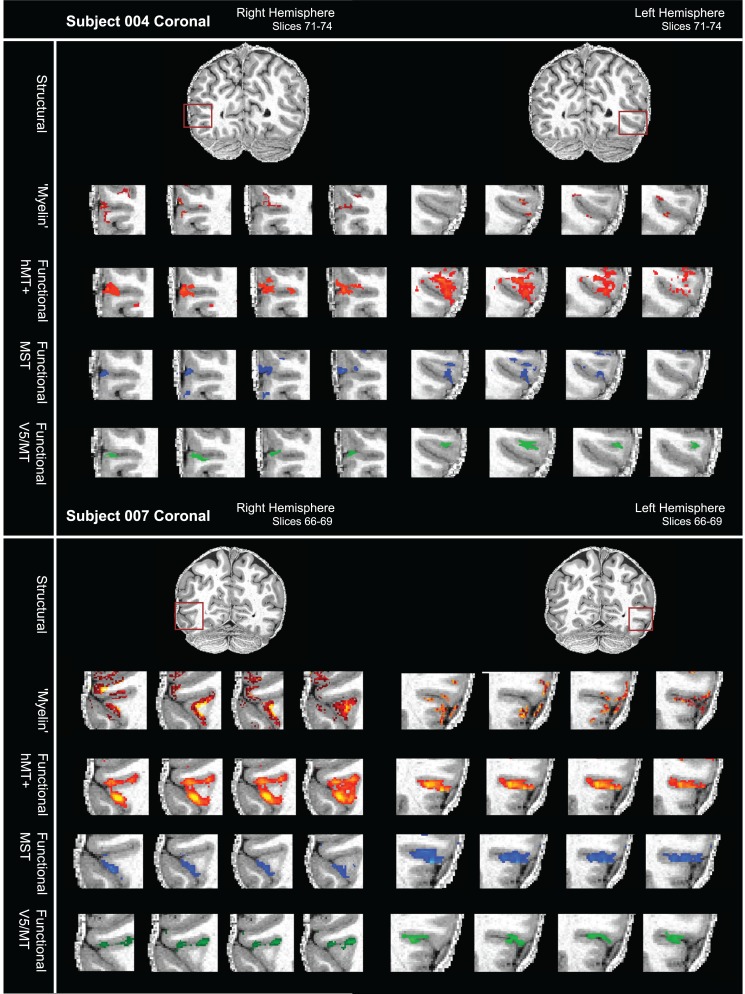
Figure 9.
Variable overlap between myelin-weighted sMRI and functional localizers for hMT+, V5/MT, and MST in native space. (A) sMRI (7T MP2RAGE) and fMRI (7T) data are shown in a series of coronal slices (1 mm separation; left to right) for both hemispheres of participant 004. From top to bottom, the sequence of slices shows first the structural scan with the myelin-weighted map overlaid (red-yellow scale; threshold at mean intensity +1 SEM), then with functional activation for full field motion (red-yellow scale; threshold: z > 2.3; cluster threshold: p = 0.05), with functional activation for ipsilateral motion (blue; threshold: z > 2.3; cluster threshold: p = 0.05) and finally with the contralateral polar retinotopic activation (green). The red box on the structural image at the top indicates location of the visual motion area hMT+. Broadly, the regions of dense myelination are next to, and to varying degrees overlapping with, the region of functional activation for hMT+. Data are generally restricted to the cortical ribbon. (B) sMRI and fMRI data for a second participant (007), conventions as in (A). Regions of dense myelination are next to, and partly overlapping with, the regions of functional activation. Data are well restricted to the gray matter. See also Supplementary Figure S2 for further examples.

