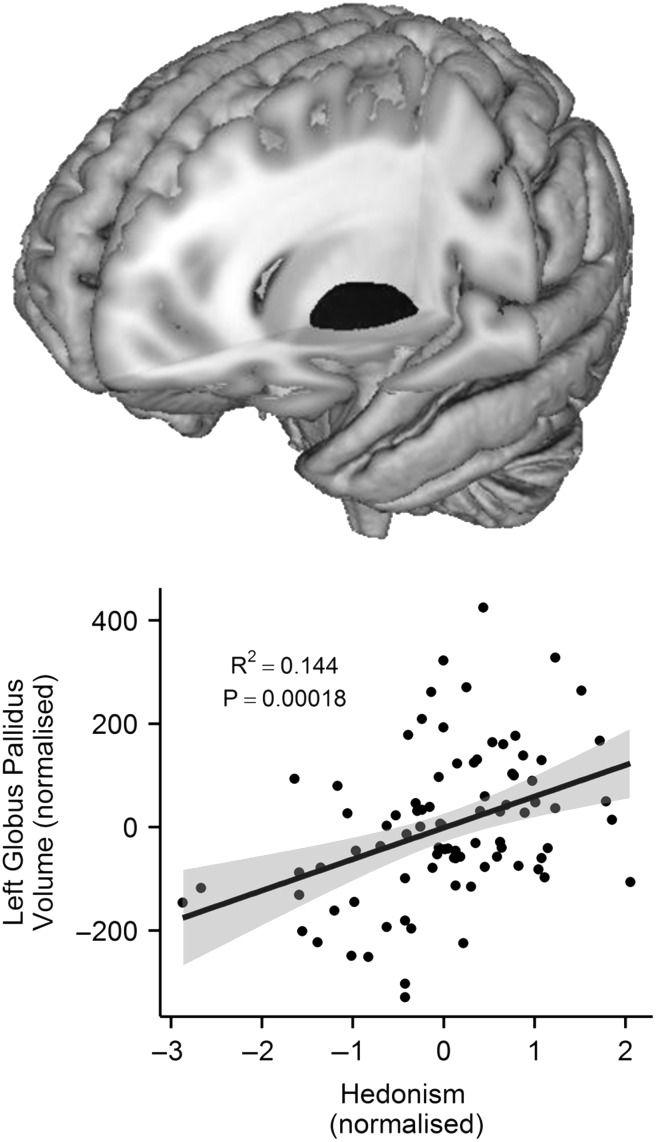
Figure 2.
A 3D-mesh of the left GP (above) and a scatter-plot of the correlation (r(84) = 0.393, P(BONF) = 0.035) between the volume of the left GP (i.e., the residual scores with age, gender and intracranial volume regressed out) (x-axis) and the standardized hedonism scores (y-axis). Each dot represents one participant. The volume of the left GP significantly predicts hedonism scores. Grey shading around the regression line represents 95% confidence interval.

